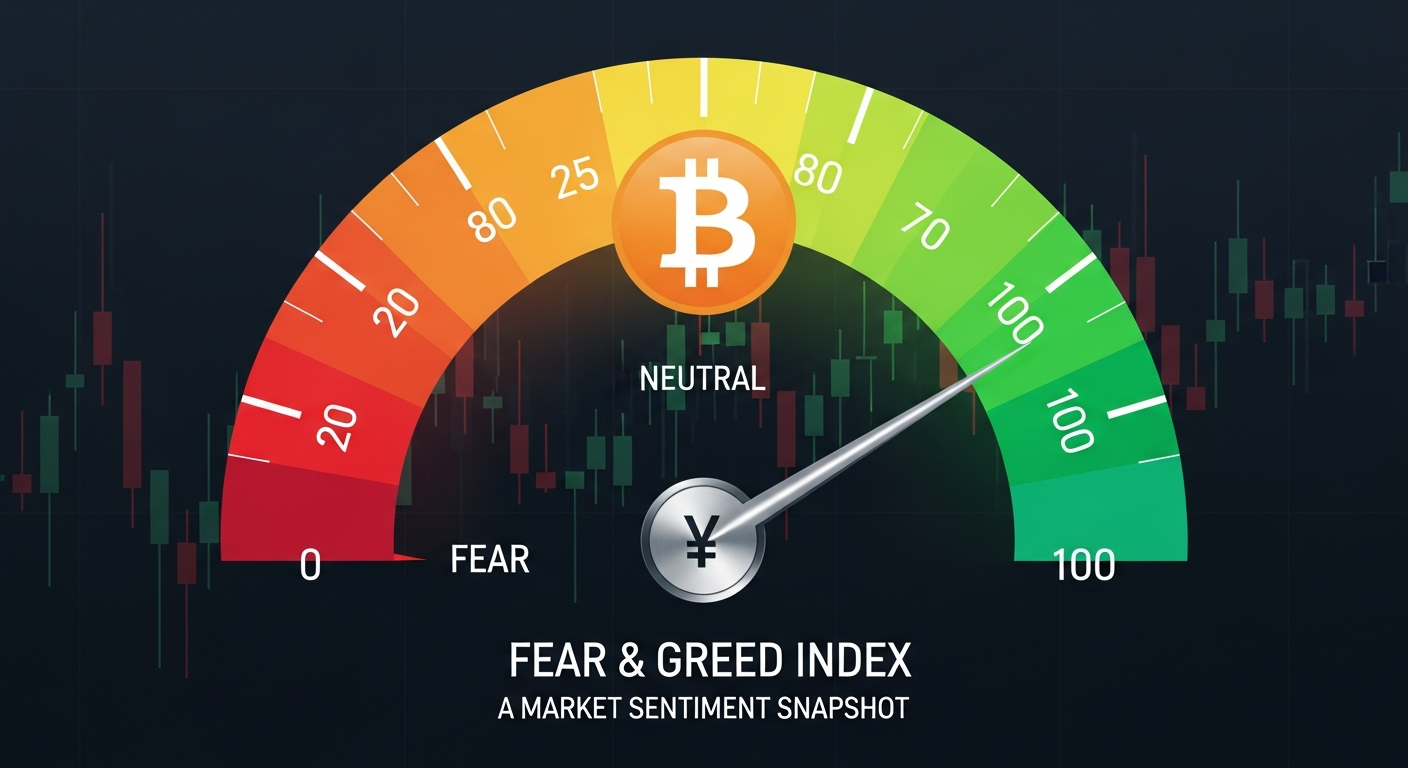
The crypto fear and greed index is a daily sentiment score from 0 to 100, built by “Alternative.me” and updated every 24 hours. Scores near 0 signal extreme fear — historically a buying opportunity. Scores near 100 signal extreme greed (becomes worrisome at times!), historically a warning. It draws on six inputs, including Bitcoin volatility, it’s trading volume, and the general social media sentiment. As per gathered research from 2023, it suggests that price moves the index more than the index moves price, so I think it is better to treat it as an emotional barometer, not a price predictor.
What Is the Crypto Fear and Greed Index?
Crypto Fear and Greed Index is a sentiment indicator that scores the crypto market from 0 (extreme fear) to 100 (extreme greed) to signal whether investors are panic-selling or overbuying.
‘Alternative.me’ launched the Crypto Fear and Greed Index in February 2018, adapting the concept directly from CNN Money’s original stock market version. The premise hasn’t changed: collective emotion drives markets away from fair value, and quantifying that emotion gives you a reference point most traders lack.
The score runs from 0 to 100. Zero means maximum fear — the kind of panic where people are selling regardless of fundamentals. One hundred means maximum greed — the kind of euphoria where people are buying regardless of price. At the extremes, the index is most useful. In the middle range, it’s more noise than signal.
Warren Buffett’s investing philosophy captures what Alternative.me was trying to build into a tool: “Be fearful when others are greedy, and be greedy when others are fearful.” The index doesn’t predict where price is going — it tells you where collective emotion currently sits, which is a different and arguably more useful thing to know.
The 0–100 Scale Explained
| Score Range | Zone | What It Signals |
|---|---|---|
| 0–24 | Extreme Fear | Panic selling, capitulation, historically favorable for patient buyers |
| 25–49 | Fear | Below-average sentiment, cautious market environment |
| 50–74 | Greed | Rising optimism, FOMO starting to build |
| 75–100 | Extreme Greed | Market euphoria, late-stage rally, historically high-risk entry point |
One thing worth noting is that since February 2018, the index has registered in Fear or Extreme Fear territory approximately 62% of the time, according to Milk Road data. The crypto market spends most of its life scared. That’s useful context when you see a fear reading — it’s less meaningful in isolation than when it’s at a multi-month extreme. To understand more about what drives these sentiment swings, the guide on what causes crypto to go up and down covers the underlying market mechanics in detail.
How Is the Crypto Fear and Greed Index Calculated?
Six data inputs feed into the daily score, each weighted differently. This matters in practice: a score of 40 built primarily on social media chatter is a different beast from one anchored in actual volatility data.
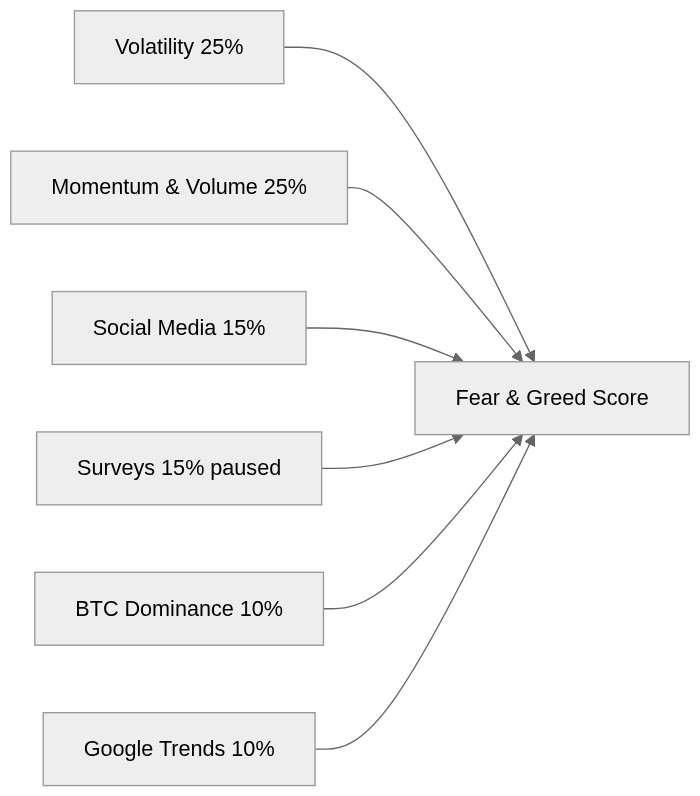
1. Volatility (25%)
Bitcoin’s current volatility is compared against its 30-day and 90-day averages. Unusual spikes — the kind you see during a flash crash or surprise regulatory announcement — register as fear. The logic is intuitive: when price swings get violent, people get anxious. What it doesn’t distinguish is whether the volatility is driven by macro factors or crypto-specific catalysts, which matters a lot (more on that later).
2. Market Momentum and Volume (25%)
Current trading volume and momentum are stacked against the same 30/90-day baselines. High buying volume in a rising market reads as greed; high selling volume in a falling market reads as fear. This is the most directly market-driven component — it’s responsive to actual trading behavior rather than perception or social chatter, which gives it more weight in our books.
3. Social Media Sentiment (15%)
Alternative.me monitors Twitter (now X) hashtag activity and posting rates around Bitcoin. High interaction rates in a bullish context push the score toward greed. It’s the most qualitative of the six inputs and the most susceptible to manipulation — coordinated shilling campaigns or coordinated FUD can temporarily distort this reading without any actual market movement behind it.
4. Surveys (15% — Currently Paused)
The original methodology included weekly polls of cryptocurrency investors. Alternative.me has paused this component (it’s explicitly labeled as paused on their methodology page), meaning it currently carries no effective weight. Worth knowing if you’re reading older analysis that references surveys as an active input — that data isn’t flowing into today’s score.
5. Bitcoin Dominance (10%)
When BTC dominance rises — meaning Bitcoin’s share of total crypto market cap is increasing — it typically signals risk-off rotation. Traders are moving from altcoins back into Bitcoin as a relative safe harbor. That reads as fear. Falling dominance (capital spreading into altcoins) registers as greed. This component functions more as a market structure signal than a sentiment one, but both are useful lenses.
6. Google Trends (10%)
Spikes in searches like “Bitcoin crash” or “Bitcoin price manipulation” indicate fear. Surges in curiosity-driven searches (“how to buy Bitcoin”) register as greed. This is genuinely a lagging signal in most cases — by the time Google search trends spike, the move is already well underway. Its 10% weight reflects that limitation.
What Does Extreme Fear in Crypto Actually Mean?
Here’s the thing that gets glossed over in most explanations: the index measures current emotion, not future price direction. That distinction is critical.
Historically, Extreme Fear readings have coincided with major market bottoms — but they don’t cause them, and they don’t reliably predict the timing of any reversal in the context of crypto market fear and greed index. On March 12, 2020 (the COVID crash that pushed Bitcoin from ~$8,000 to ~$3,800 in 24 hours), the index registered 8. During the Terra/LUNA collapse aftermath in June 2022, it hit an all-time low of 6. When FTX imploded in November 2022, it dropped back to 12.
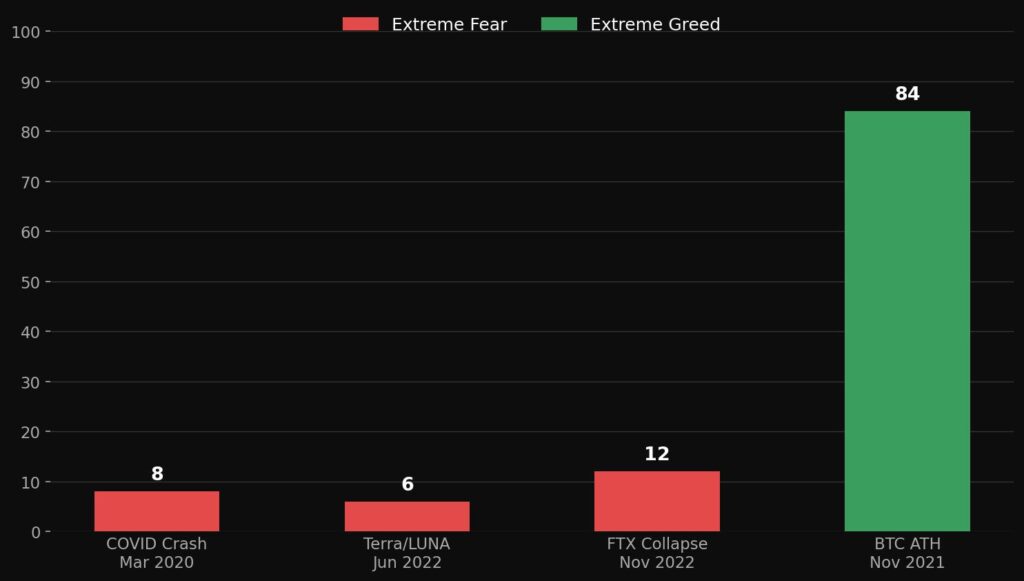
In all three fear cases, buying would have eventually paid off — often substantially. But “eventually” can mean three to eighteen months. The index tells you sentiment is at a floor. It doesn’t tell you price has found one.
At the other extreme: on November 9, 2021 — one day before Bitcoin hit its then-all-time high of $69,044 — the index registered 84, firmly in Extreme Greed territory. In retrospect, a near-perfect warning. In real time, it felt like momentum.
A 2023 peer-reviewed study published on ScienceDirect examined daily data from 2018 to 2025 and arrived at something counterintuitive: Bitcoin’s price changes Granger-cause the Fear and Greed Index, but not the other way around. Price moves sentiment — not the reverse. The index is a mirror of what already happened rather than a window into what comes next.
That finding doesn’t make it useless. It changes how you should use it.
Honestly, I’ve found the index most useful not as a timing tool but as an emotional reality check. When I’m feeling strongly about buying something and the index is sitting above 80, that’s a signal to pause and ask whether I’m responding to analysis or just absorbing sentiment from social media. When I can’t bring myself to check charts during a crash, and the index is printing 10, that’s usually the moment worth actually paying attention to. Used that way it acts as a check on your own emotional state and it earns its place in the toolkit.
“Bitcoin frequently acts like a risk-on asset in the markets. It can be quite volatile, and its price fluctuates with sentiment.” — Lyn Alden, macroeconomist and General Partner at Ego Death Capital
How Do Traders Actually Use the Fear and Greed Index?
Every explainer says “buy fear, sell greed.” Almost none of them walk through what that actually looks like. Here’s a practical framework.
The basic contrarian approach:
- Set thresholds — some traders use sub-20 as a buy zone, above 80 as a sell zone. Others use sub-25 and above 75 to match the official “Extreme” ranges
- Enter using dollar-cost averaging, not a single buy — Extreme Fear can persist for weeks or months. A single large entry at the wrong moment within that window is painful
- Cross-check with price levels — an index reading of 15 with Bitcoin at strong on-chain support is a meaningfully different setup from a reading of 15 with price still in technical freefall
- Exit planning goes in before entry — emotional exhaustion during prolonged fear periods causes people to sell just before recoveries. Plan your exits when you’re calm, not when you’re panicking
The index updates every 24 hours, which makes it unsuitable for intraday or day trading decisions. It works best for swing and position traders building entries over days or weeks. A reading of 15 doesn’t mean “buy in the next 15 minutes” — it means the market environment has historically favored patient accumulation.
The swing trading guide covers how to integrate sentiment indicators into a broader technical setup for medium-term trades. If you’re managing shorter timeframes, the day trading cryptocurrency guide explains why sentiment indicators play a smaller role in faster-moving strategies.
One more thing worth flagging: since the index registers Fear or Extreme Fear about 62% of the time since 2018, a reading of “50 — Neutral” is actually above average sentiment for crypto markets. Most traders anchor against the midpoint of the scale without realizing the historical distribution skews heavily negative. That reframing changes how you interpret a reading of 45 versus a reading of 25.
When the Fear and Greed Index Gets It Wrong
This section is noticeably absent from most articles about the index. Let’s address it.
- Macro-driven shocks. In April 2025, broad US tariff announcements sent global risk assets lower, Bitcoin included. The fear reading spiked — but the driver was entirely external. Buying “crypto Extreme Fear” during a macro risk-off event is a fundamentally different bet from buying crypto-specific capitulation. The index cannot distinguish between the two.
- Altcoin-specific collapses. The index is calibrated to Bitcoin. Terra/LUNA wiped out tens of billions in market cap within days in May 2022, and while the index eventually hit its all-time low a month later (June 6 at 6), it didn’t front-run the LUNA depeg. If you were holding LUNA when it started unwinding, a Bitcoin sentiment indicator wasn’t going to save you.
- Social media manipulation. The 15% social media weighting is the most gameable part of the methodology. During coordinated shilling campaigns or token launches with aggressive influencer involvement, the sentiment reading on X can spike without any genuine shift in market conviction. The index has no mechanism to filter this out.
- Bear market relief rallies. During prolonged downtrends, the index periodically bounces into mild Greed territory during 30-40% relief rallies — only to drop back into Fear as the broader trend reasserts itself. The 2022 bear market had multiple such rallies. The index read “Greed” during each of them. That’s not the index being wrong, exactly — sentiment genuinely improved during those rallies. But it illustrates the difference between a cyclical sentiment bounce and a structural reversal.
Understanding these failure modes matters particularly if you’ve read about crypto bubble cycles — the fear and greed index often registers its most misleading readings precisely during the peak and trough of those cycles, when it should theoretically be most useful.
None of this argues against using the index. It argues for using it as one input alongside on-chain metrics, technical levels, and macro context rather than as a standalone trigger. The fundamental analysis for crypto guide walks through how to layer these different signal types into a coherent framework.
Does the Fear and Greed Index Work for Altcoins?
The index is built for Bitcoin. Full stop. It uses Bitcoin’s volatility, Bitcoin’s trading volume, and Bitcoin’s dominance data as its primary inputs. That doesn’t mean it’s irrelevant for altcoin traders — but it needs reframing.
In practice, altcoin sentiment amplifies Bitcoin’s cycles rather than running independently. During Extreme Greed periods, altcoins typically outperform Bitcoin dramatically — FOMO capital rotates into higher-risk assets chasing bigger percentage gains. During Extreme Fear, altcoins tend to underperform Bitcoin as capital seeks relative safety. So the index gives a useful directional signal even for altcoin positioning, as long as you account for that amplification effect.
Having said that, the amplification cuts both ways. A fear reading of 15 that’s “safe to buy Bitcoin” can still mean “dangerous to buy mid-cap altcoins” if those assets haven’t flushed out their leverage yet. Bitcoin recovering 20% from a fear extreme doesn’t mean your altcoin portfolio recovers proportionally.
For traders with altcoin-heavy portfolios, platforms like CFGI.io track real-time fear and greed readings for 50+ individual tokens. Less historical data to validate against, but they give you asset-specific sentiment rather than Bitcoin-proxied readings.
The Bottom Line on the Crypto Fear and Greed Index
I think of the crypto fear and greed index as a daily emotional temperature reading — useful for knowing whether the market is panicking or euphoric, less useful for predicting what happens next. The 2023 ScienceDirect research confirming that price Granger-causes sentiment (not the reverse) is the most honest summary of what the tool can and can’t do.
What it can do: the historical extremes are hard to dismiss. Readings below 10 have consistently marked capitulation events worth paying attention to. Readings above 80 have consistently marked overheated market phases where new entries deserve extra scrutiny. As a cross-check on your own emotional state during volatile periods, it’s genuinely valuable — precisely because it replaces gut feel with a number.
What it can’t do: distinguish macro shocks from crypto-specific panic, predict the timing of reversals, or tell you anything specific about altcoins.
Built into a broader framework — combined with on-chain metrics, technical support levels, and an honest read on macro conditions — the fear and greed index earns its place in any active crypto trader’s toolkit. Used alone, it’s a blunt instrument.
Frequently Asked Questions
1. How often is the crypto fear and greed index updated?
Once daily. It’s not a real-time indicator, if you check it during an intraday move, you’re looking at yesterday’s reading. For higher-frequency sentiment data, platforms like Santiment and LunarCrush update more often, though they use different methodologies and aren’t directly comparable to the Alternative.me index.
2. Who created the crypto fear and greed index?
Alternative.me built and maintains it, launching in February 2018. The design was adapted from CNN Money’s Fear & Greed Index for traditional stock markets, which was itself grounded in behavioral finance research showing that fear and greed systematically push markets away from fair value. CNN’s version is still active and covers equities, the two indices use different data sources but share the same underlying philosophy.
3. Can you use the fear and greed index for altcoins?
Yes, with important caveats. The index is calibrated to Bitcoin metrics, so it functions as a directional gauge for the broader market rather than altcoin-specific sentiment. Altcoin moves tend to amplify Bitcoin’s cycles — greed reads often precede stronger altcoin rallies, fear reads often precede sharper altcoin drawdowns. For token-specific readings, CFGI.io covers 50+ assets individually.
4. What happens to my portfolio during extreme fear?
Extreme fear (below 25) typically coincides with sharp drawdowns and panic selling. Historically these periods have offered favorable long-term entry points — but fear can intensify before reversing, and the timing of any bottom is unknowable in advance. Dollar-cost averaging into positions during extreme fear has generally outperformed lump-sum entries, because it removes the pressure of calling the exact low.
5. Is the fear and greed index a reliable standalone trading signal?
No, and the research supports this. The 2023 peer-reviewed study published on ScienceDirect found that Bitcoin returns Granger-cause the index rather than the other way around, meaning the index largely reflects what already happened rather than predicting what comes next. Use it as one input in a broader decision framework — not as a trigger by itself.

Our Review Methodology
We evaluate each post based on thorough research, credibility of sources, accuracy of information, and relevance to our readers. Our editorial team follows strict guidelines to ensure all content meets high standards of quality.
Disclaimer
The content in this article is provided for informational purposes only and does not constitute financial, investment, or professional advice. Always do your own research before making any decisions.