
Crypto charts can look like chaos if you stare at raw price candles. Every spike, every dip, every sideways grind — it’s hard to tell signal from noise. Moving averages exist for exactly this problem. They smooth out price data into a single line that shows you the actual direction of the market, cutting through short-term volatility that would otherwise make you second-guess every trade.
Most crypto traders, from Bitcoin day traders to long-term holders, rely on at least one moving average in their analysis. When Bitcoin consistently trades above its 200-day simple moving average, it signals a bull market — and below it, prolonged weakness. That one data point influences billions in trading decisions.
A moving average calculates the average price of a cryptocurrency over a set number of periods, creating a smoothed trend line. The two most common types are SMA (Simple Moving Average) and EMA (Exponential Moving Average). Key signals include the golden cross (bullish) and death cross (bearish). Bitcoin’s 50-day SMA reached a record six-figure high in June 2025, per CoinDesk.
What Is a Moving Average in Crypto?
A moving average (MA) is a technical indicator that takes the average closing price of a cryptocurrency over a defined number of time periods — 20 days, 50 days, 200 days — and plots it as a continuously updating line on a price chart. As each new period closes, the oldest data point drops off and the newest one gets added. Hence “moving.” It’s not complex math. It’s the simplest filter you can apply to raw price noise.
The reason traders care about moving averages isn’t the calculation — it’s what the line shows. A rising MA means average prices are trending up. A falling MA means the opposite. And when price crosses above or below the MA line, you get the kind of signal that triggers buy and sell decisions across thousands of accounts simultaneously. That collective attention is what gives certain moving averages (particularly the 50-day and 200-day) their near-mythological status in crypto markets.
How Is a Moving Average Calculated?
The basic formula: add the closing prices for n periods and divide by n. So a 10-day SMA on Bitcoin adds the last 10 daily closes and divides by 10. Each day, you drop the oldest price and add the newest. The line updates constantly as price moves, which is why it “moves.”
EMA uses a slightly more complicated formula that applies an exponential multiplier: 2 ÷ (number of periods + 1). A 10-period EMA uses a multiplier of 0.18, meaning recent prices carry 18% of the weight. The result is a line that hugs price action more tightly than SMA — useful in fast-moving crypto markets where conditions shift in hours, not weeks.
Simple Moving Average vs. Exponential Moving Average: Which Should You Use?
Both indicators calculate the same fundamental thing — average price over time — but they react to price differently enough that they suit different trading styles.
The SMA treats all periods equally. A 50-day SMA weights a Bitcoin close from 48 days ago exactly the same as yesterday’s close. That smoothness is the point: SMA cuts through short-term volatility and shows you the longer-term trend without reacting to every news event. The trade-off is lag. By the time SMA signals a trend reversal, the move has often been underway for days.
The EMA front-loads recent data. That June 2025 close gets more weight than the close from 30 days ago, so EMA hugs current price action more closely. It’s faster, more responsive — and in volatile crypto markets, that speed matters. The downside: EMA also picks up more false signals during choppy, sideways periods when price bounces around without real direction.
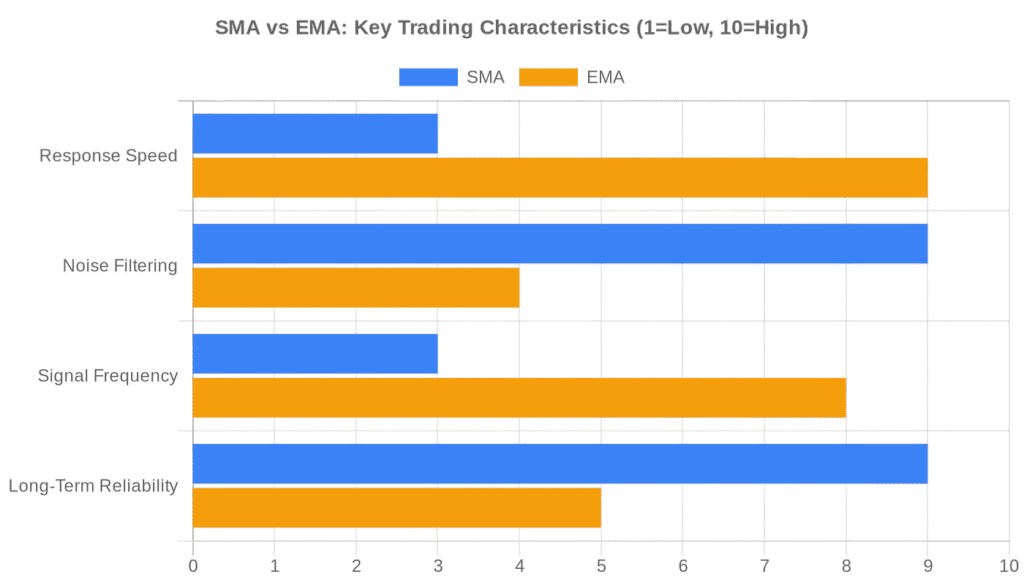
When SMA Works Better
Long-term trend analysis is where SMA earns its reputation. Institutions and larger funds use the 200-day SMA as a market health barometer because its slow, stable nature filters out noise that would trigger unnecessary trades. If you’re holding Bitcoin for months and want to know whether the macro trend is still intact, SMA is your friend. It’s also easier to interpret: the line doesn’t jump around, so support and resistance levels it creates tend to hold over longer timeframes.
When EMA Works Better
Short-term and swing traders generally prefer EMA because crypto markets move faster than traditional assets. A 9-period or 21-period EMA on a 4-hour chart gives you earlier entries and exits than a comparable SMA would. The 9/21 EMA crossover is a popular short-term signal: when the 9 EMA crosses above the 21 EMA, it’s a potential long entry; below, a potential short. It’s not foolproof — nothing in crypto is — but it’s responsive enough to be useful when you’re trading in-and-out over days rather than months.
What Does the 50-Day Moving Average Tell Crypto Traders?
The “50-day-moving average” is probably the most-watched short-to-medium term indicator in crypto. When Bitcoin’s price breaks above the 50-day SMA, technical traders broadly interpret it as a bullish momentum shift — buy pressure has overwhelmed sell pressure consistently over nearly two months. When it breaks below, the read reverses.
In October 2025, Bitcoin crossed back above its 50-day SMA after a period of weakness, validating the bullish read when MACD also confirmed the breakout (CoinDesk). That kind of multi-indicator confirmation is exactly how professional traders use the 50-day — not as a standalone signal, but as part of a broader technical picture.
It’s worth noting that the 50-day MA’s influence is partly self-fulfilling. So many traders and algorithms watch it that breaches of the line generate real buying or selling activity, which reinforces the signal. This is true of most widely-watched technical levels in crypto.
What Is the 200-Day Moving Average — and Why Does It Matter?
The 200-day SMA is the long-term dividing line in crypto markets. Bitcoin above the 200-day = bull market. Bitcoin below the 200-day = bear market. This isn’t our opinion — it’s as close to an institutional consensus as you get in an asset class that otherwise resists consensus on almost everything.
When Bitcoin’s 50-day SMA climbed into six figures for the first time in June 2025, setting a new record high for the indicator, that milestone reflected months of consistent price action above the 200-day baseline — a structurally healthy market, not just a speculative spike (CoinDesk).
For altcoins, the logic scales. The 200-day SMA tells you whether an asset is in recovery or still in structural decline. It’s a slower signal than the 50-day, which means it’s less useful for timing trades — but for deciding whether you want exposure to an asset at all, the 200-day gives you the clearest read available from a single indicator.
I started paying serious attention to the 200-day SMA after watching Bitcoin reclaim it in early 2023. I had been tracking the price daily through the post-FTX collapse, and the line had acted as a ceiling for months — every rally faded right at it. When Bitcoin finally closed above it and held for three consecutive weeks, I used that as my signal to start rebuilding a long position. It wasn’t a perfect entry — the thing was still declining at that point — but it was the first structural signal that the market regime was shifting. That trade changed how I weigh this portion in my analysis.
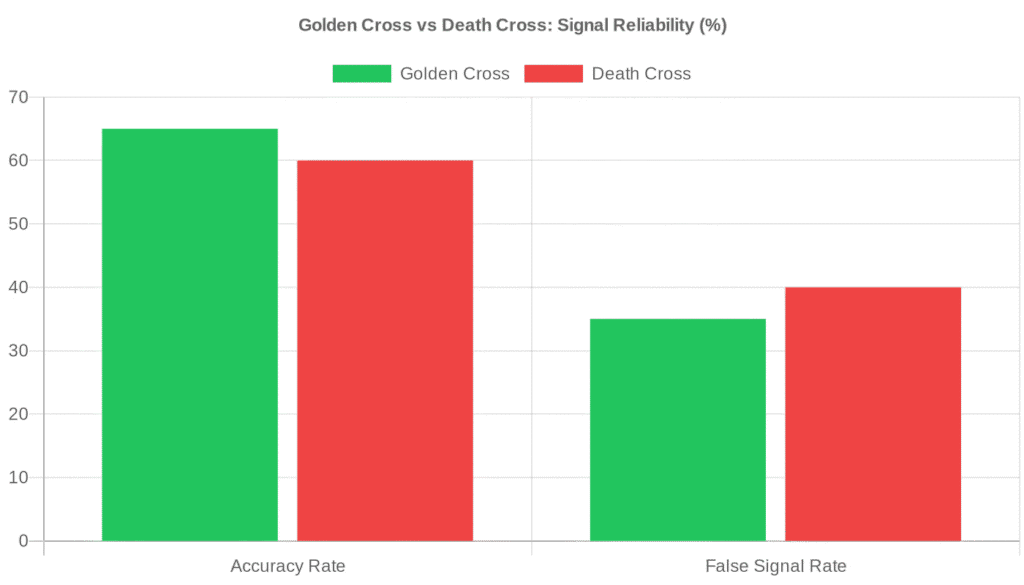
Golden Cross vs. Death Cross: How to Read Crossover Signals
The golden cross and death cross are the two most-discussed crossover patterns in crypto — and for good reason. They’re simple, visually obvious on a chart, and historically connected to significant market moves. They’re also lagging signals that will never get you in at the exact bottom or out at the exact top. Understanding both the power and the limitation is what separates traders who use them well from those who get burned by false signals.
What Is a Golden Cross?
A golden cross occurs when the 50-day MA crosses above the 200-day MA. It signals a shift from bearish to bullish momentum — the shorter-term trend has now overtaken the longer-term average, suggesting that recent buying activity is strong enough to redefine the trend. Binance Academy describes three phases: the downtrend exhausts itself, the shorter MA crosses upward, and then the uptrend is confirmed by continued price action above both MAs (Binance Academy).
Bitcoin’s golden cross in early 2023 — when the 50-day crossed above the 200-day after the post-FTX collapse — is a widely-cited example. It wasn’t a guarantee of further gains, but it confirmed that the worst of the selling pressure had passed. In our view, it was one of the cleaner signals of that cycle.
What Is a Death Cross?
The death cross is the inverse: the 50-day MA crosses below the 200-day, signaling that downward momentum has taken hold. Historically, death crosses preceded major market downturns in the 1929 and 2008 stock market crashes, and they’ve marked the beginning of crypto bear phases as well (Binance Academy).
Having said that, death crosses also produce false signals. I can point it out. So, the 2016 SPX death cross is a textbook example of a signal that reversed quickly without a sustained bear market following. In crypto specifically, where price action is faster and more violent than equities, death crosses can and do trigger buying opportunities when they occur during macro bull cycles. Context matters.
“The most important thing about a moving average is not what it is, but what it does — it defines the trend, and the trend is the only thing worth trading.” — Martin Pring, Author, Technical Analysis Explained
False Signals and How to Confirm Them
Volume is your primary confirmation tool. A golden cross with rising volume behind it is a much stronger signal than a crossover that happens on thin, directionless trading. The same applies to death crosses — a crossover with heavy selling volume confirms bearish momentum; one that occurs on low volume warrants skepticism.
Secondary confirmation: check where RSI sits when the cross forms. An RSI above 60 on a golden cross reinforces the bullish signal. RSI below 40 during a death cross confirms bearish momentum. Neither RSI nor volume makes the crossover infallible, but they reduce the probability of trading a false signal.
How to Build a Moving Average Trading Strategy in Crypto
Moving averages work best when they’re part of a system, not used in isolation. Here are the combinations that show up most often in professional crypto trading setups — and why they work.
- The 9/21 EMA crossover is the go-to short-term setup. On a 4-hour chart, the 9-period EMA crossing above the 21-period EMA signals momentum in the up direction; crossing below signals down. It’s fast, which makes it suitable for swing trading over days. The catch: in sideways markets, the 9 and 21 EMAs will cross back and forth repeatedly, generating whipsaw signals that eat into P&L through bad entries. Filter it by only taking crossover signals when price is also above the 200-day SMA — that reduces noise significantly.
- The 50/200 day SMA setup is the long-term institutional approach. Simple rule: if Bitcoin is above its 200-day SMA, you can use the 50-day SMA as a dynamic support level — dips to the 50-day in an uptrend are potential buying opportunities. If Bitcoin is below the 200-day, invert the logic: rallies to the 50-day become potential short entries or profit-taking levels.
- Multi-MA stacks — running three MAs simultaneously (e.g., 20, 50, 200) — give you a tiered trend picture. When price is above all three, arranged in bullish order (20 > 50 > 200), the trend is clearly up. When they invert (200 > 50 > 20), it’s clearly down. And when they’re tangled together, trending sideways — that’s the market telling you it doesn’t have direction, and MA signals should be treated with extra skepticism.

Moving Average Limitations: What Traders Get Wrong
Moving averages are lagging indicators — they’re built from historical price data, which means they confirm trends, they don’t predict them. This sounds obvious, but it’s worth sitting with: by the time a golden cross forms, Bitcoin has already moved significantly in the bullish direction. You’re not getting in at the bottom; you’re getting confirmation that the bottom might be behind you.
In crypto, this lag is more costly than in traditional markets because the moves are faster and sharper. A golden cross that forms after a 30% rally doesn’t represent the same opportunity as one that forms after a 5% move. Position sizing matters. If you’re entering based purely on a crossover signal, make sure you’re accounting for the fact that a substantial portion of the move has already happened.
Sideways markets are where moving averages fail most visibly. When Bitcoin trades in a tight range for weeks, the 50-day and 200-day MAs converge and the price line chops through them both repeatedly. Every chop generates a new crossover signal. Traders who treat every crossover as a real signal in a ranging market will rack up losses quickly. The tell: when the 200-day MA flattens out and starts moving horizontally, moving average signals lose their reliability. Check price context before acting on any crossover.
“A moving average is a trend-following, or lagging, indicator. It will always be a step behind — and that’s not a flaw, that’s the design. The question is whether you’re using it to confirm strength or to chase it.” — John Murphy, Author, Technical Analysis of the Financial Markets
- Volatility-specific caveat: crypto assets have higher volatility than the equities and forex markets where many MA strategies were originally developed. A strategy backtested on the S&P 500 using the 50/200 SMA crossover won’t translate to ETH or SOL with the same results. The signal frequency is varies, the false signal rate is higher, and the magnitude of moves between signals is larger. Treat published backtests skeptically unless they’re built specifically on crypto data.
The Bottom Line on Moving Averages in Crypto
Moving averages are the most widely used technical tool in crypto trading for a reason: they give you a clear, objective read on trend direction in a market that otherwise rewards whoever can filter noise most effectively. SMA gives you the stable, institutionally-watched long-term picture; EMA gives you responsive short-term signals; and the golden and death crosses give you high-visibility momentum shifts that most of the market is watching simultaneously.
The limitation is the one you can’t get around: they lag. They confirm, not predict. Used as confirmation — backed by volume, RSI, or fundamental context — they’re among the most reliable tools in a crypto trader’s kit. Used in isolation, they’ll lead you into trades that have already run their course.
Frequently Asked Questions
1. Which moving average is best for crypto trading?
It depends on your timeframe. The EMA is generally preferred for short-term and swing trading because it responds faster to recent price changes — many traders use the 9/21 EMA crossover on 4-hour charts. For long-term trend analysis, the 200-day SMA is the benchmark most institutional traders and analysts reference when assessing Bitcoin’s overall market structure.
2. What’s the difference between SMA and EMA in crypto?
SMA (Simple Moving Average) gives equal weight to every price in the period — a 50-day SMA weights day 1 and day 49 identically. EMA (Exponential Moving Average) applies an exponential multiplier that gives more weight to recent closes, making it more responsive to current price action. In practice: SMA is smoother and slower; EMA is noisier and faster.
3. Is the golden cross a reliable buy signal in crypto?
It is to an extent, but not entirely. The golden cross (50-day MA crossing above the 200-day) has historically preceded bullish periods, including Bitcoin’s 2023 recovery. Confirm with volume (rising volume = stronger signal) and RSI before acting. Never use it as your sole reason to buy.
4. Can I use moving averages for day trading crypto?
Yes, but you need shorter periods. Day traders typically use 9, 21, or 50 periods on 1-hour or 4-hour charts rather than the daily-chart MAs. If you’re trading on a 15-minute chart, then a 200-period MA on that timeframe gives you a comparable picture to the 200-day MA on a daily chart. The principle is the same; the timeframe shrinks.
5. What are the best moving average settings for Bitcoin?
The most-watched settings: 50-day and 200-day SMA for macro trend analysis; 9-period and 21-period EMA for short-term momentum. There’s no universally “best” setting — the 50 and 200 carry weight partly because so many traders use them. If you want to experiment, try the 20-day SMA as a medium-term support/resistance level. It shows up frequently as a dynamic support level during Bitcoin bull markets.
Trading cryptocurrencies carries significant financial risk. This article is educational only and does not constitute investment or financial advice. Always conduct your own research and consider your risk tolerance before making any trading decisions.
Our Review Methodology
We evaluate each post based on thorough research, credibility of sources, accuracy of information, and relevance to our readers. Our editorial team follows strict guidelines to ensure all content meets high standards of quality.
Disclaimer
The content in this article is provided for informational purposes only and does not constitute financial, investment, or professional advice. Always do your own research before making any decisions.