
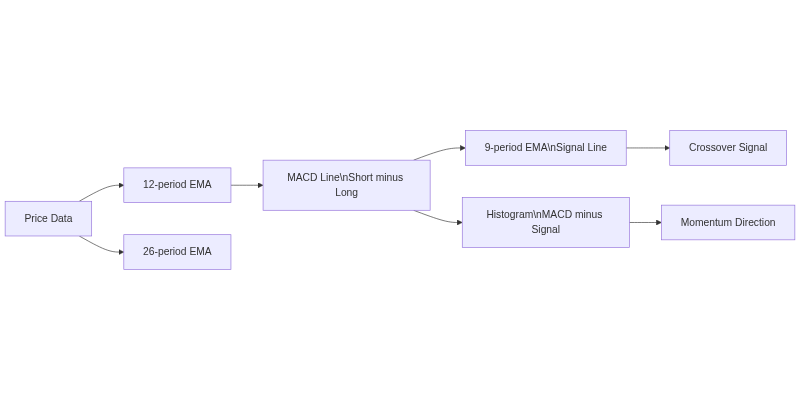
MACD (Moving Average Convergence Divergence) tracks the relationship between a 12-period and 26-period exponential moving average to measure momentum. The standard 12/26/9 settings, created by Gerald Appel in 1979, still form the baseline for most crypto traders. In MACD Indicator Crypto Trading, crossovers signal trend direction, divergences flag reversals before price confirms them, and the histogram shows whether momentum is accelerating or fading in real time.
Gerald Appel developed the MACD indicator in 1979 to track momentum shifts by measuring the relationship between two exponential moving averages, specifically, the 12-period and 26-period EMAs (Investopedia, 2024). The resulting MACD line oscillates above and below zero as those averages converge and diverge, giving traders a continuous read on whether short-term momentum is outpacing the longer-term trend.
For crypto traders, this is either comforting or mildly ironic. An indicator calibrated for daily stock charts in the late 1970s is now one of the most-used tools on TradingView, CoinGlass, and essentially every crypto charting platform in existence. The mechanics hold up. But the asset class is different, Bitcoin can move 10% in a day, altcoins can double in a week, and markets run 24/7 without closing bells. That context shapes how you read MACD signals in crypto versus how equity traders use it.
The Three Components of MACD
There are three elements on your chart, and they all do different jobs:
- MACD Line: The difference between the 12-period and 26-period EMAs. A positive value means the short-term average is above the long-term average — upward momentum. A negative value means the inverse.
- Signal Line: A 9-period EMA of the MACD line itself. It smooths out the noise and creates the crossover signals most traders focus on. Slower than the MACD line, but more deliberate.
- Histogram: Visual bars representing the distance between the MACD line and the signal line. Bars above zero mean the MACD line is above the signal line; bars below zero mean the opposite. When bars start shrinking, momentum is weakening — sometimes before price has moved at all.
How to Read MACD Indicator Crypto Signals on a Crypto Chart
The histogram is where most serious analysis actually happens, because it answers the question the two lines can’t on their own: is momentum building or dying? (altFINS, 2026). You’re not just checking which side of zero you’re on. You’re watching direction, a histogram shrinking from positive territory can signal a trend pause even if price is still climbing.
Timeframe matters enormously here. On a 15-minute chart, MACD generates crossovers constantly, and most of them resolve into noise. On a daily or weekly chart, the same crossover carries a different kind of weight, it’s reflecting the convergence of larger moving averages, which take weeks to form. Major Bitcoin trend shifts, historically, have often been preceded by weekly MACD crossovers that held for weeks before price followed.
The MACD Line and Signal Line
The MACD line is reactive. It moves fast, built from short-period EMAs that respond quickly to price. The signal line is the steadying influence, slower, smoother, and more useful for confirming whether a signal is real rather than a knee-jerk response to a price spike.
When the MACD line is above the signal line, price has upward momentum. When it drops below, downward pressure is in control. The crossovers between these two lines are where most trading signals originate.
The Histogram: Your Momentum Gauge
The histogram is the derivative of those two lines — it shows you the rate of change, not just the direction. Bars growing taller in positive territory = accelerating bullish momentum. Bars shrinking toward zero in positive territory = buyers slowing down. When bars flip to negative, sellers have taken over.
This is why experienced traders often check the histogram first. It gives you the earliest possible read on momentum shifts, before a crossover even happens.
What Does a Bullish MACD Crossover Mean?
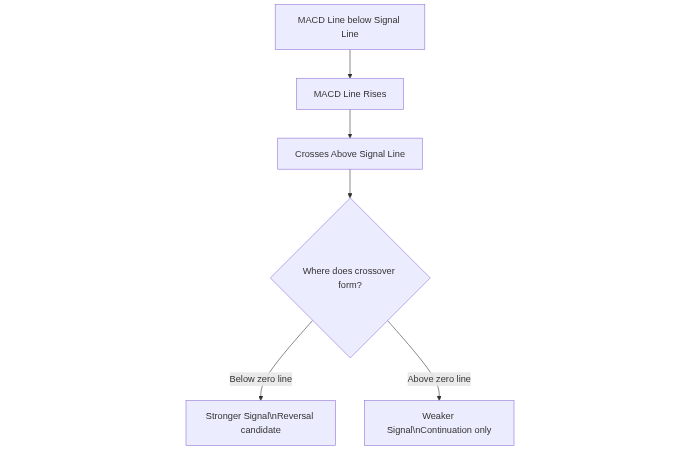
A bullish MACD crossover occurs when the MACD indicator line crosses above the signal line, signaling that short-term momentum is accelerating faster than the longer-term trend — a potential entry point for buyers (Phemex Academy, 2026). In crypto markets, crossovers that form below the zero line carry extra significance: the indicator is emerging from bearish territory, suggesting a reversal rather than a simple continuation of existing strength.
Not all bullish crossovers are equal, and that’s where a lot of beginner traders get caught. A crossover that forms when the MACD line has been deeply negative for weeks — then slowly climbs above the signal line — is making a structural statement about momentum. A crossover that forms right near the zero line, after a brief dip, is considerably less meaningful.
If you’re watching Bitcoin or Ethereum on weekly charts, bullish crossovers from below zero have historically aligned with early-stage trend recoveries. That’s the setup most worth tracking for longer-term positions. For shorter timeframes, expect more false signals.
What Is a Bearish MACD Crossover?
The bearish crossover is the mirror: the MACD line crosses below the signal line, indicating that downward momentum is asserting itself over the short-term trend (Phemex Academy, 2026). For crypto traders, bearish crossovers forming in positive territory (above zero) are the most watched — they signal that an uptrend is running out of momentum.
In strong crypto bull markets, bearish crossovers on 4-hour charts can produce a lot of false signals. Crypto bounces hard. A bearish crossover that forms in the middle of a macro uptrend, confirmed by nothing else, is often just a short-term retracement.
On the daily chart, after an extended rally with no pullback — that deserves more attention. It’s worth noting that pairing bearish crossovers with volume data changes the equation considerably. A crossover accompanied by rising volume is more credible than one that forms on declining volume, where selling pressure may not be genuine.

All About Divergence
Divergence is the highest-conviction signal MACD generates and the one most traders either miss or misinterpret (altFINS, 2026). It occurs when price and MACD move in opposite directions: price makes a new high while MACD makes a lower high, or price makes a new low while MACD makes a higher low. The divergence tells you the trend is losing its structural support even though price hasn’t confirmed the reversal yet.
This is the useful distinction. MACD divergence is a bias indicator, not a trigger. It sets the frame of reference it says “momentum is weakening here” but it doesn’t tell you when to act. You still need price action confirmation (a break of support, a rejection candle) before entering a position based on divergence alone.
“Divergence is one of the most powerful concepts in technical analysis — when price and momentum disagree, momentum is usually right.” — John Murphy, Author, Technical Analysis of the Financial Markets
Bullish MACD Divergence
I remember watching Ethereum in late 2022, during one of the nastier stretches of that bear market. ETH was making lower price lows, week after week nothing to suggest a bottom was near. But on the weekly MACD chart, something didn’t match. The MACD lows were rising, even as price lows fell. Classic bullish divergence. It wasn’t a signal to buy immediately, but it was a strong enough flag to stop adding to short positions and start watching for confirmation. ETH’s subsequent recovery vindicated the setup, the divergence had caught weakening sell pressure before price did.
The pattern: Price makes a lower low → MACD makes a higher low → downtrend losing structural momentum. Most reliable on daily or weekly crypto charts.
Bearish MACD Divergence
Bitcoin’s late 2021 run toward all-time highs included several instances of bearish divergence. Price kept making new highs; MACD peaks were trending lower with each successive high. That divergence wasn’t a sell signal on its own momentum can continue for a long time after divergence forms. But it was a clear structural warning that buying pressure wasn’t confirming the new price levels.
The pattern: Price makes a higher high → MACD makes a lower high → uptrend losing momentum. Useful for risk management: reduce position size, tighten stop-losses, avoid adding new longs.

MACD Crypto Strategy: Combining Signals for Stronger Trades
Experienced traders rarely use MACD as their only filter, and the reason is straightforward: in ranging, sideways markets, MACD generates crossovers without directional intent, creating false signals that can erode capital quickly (UEEx Technology Blog, 2026). A second confirmation layer changes this.
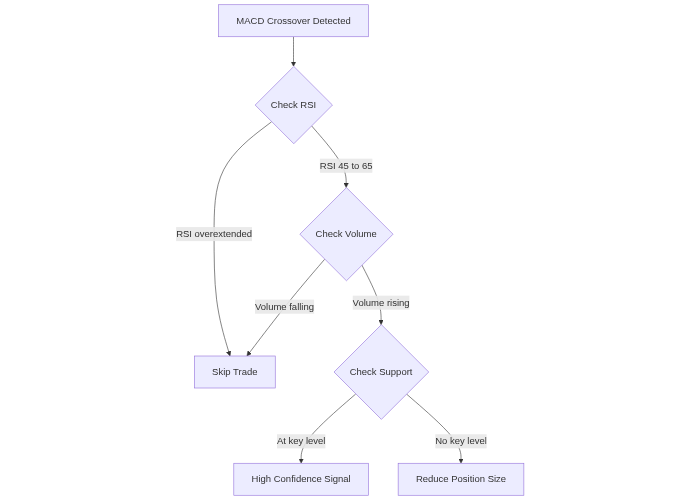
- MACD + RSI: A bullish MACD crossover paired with RSI above 50, trending up but not overbought, is a stronger setup than either signal alone. Both would need to agree on direction before entry. If RSI is at 75 when a bullish MACD crossover forms, you might be entering late into an exhausted move.
- MACD + Volume: Crossovers accompanied by rising volume carry more credibility. The volume confirms that actual buying or selling pressure is behind the signal, not just algorithmic noise or thin market conditions.
- MACD + Support and Resistance: A bullish crossover at a key support level, one that’s held multiple times before, combines technical frame of reference with momentum confirmation. The two filters together reduce the probability that you’re chasing a false breakout.
For traders on Tradelize, watching how experienced portfolio managers apply these combinations in live conditions can accelerate the learning curve considerably. The day trading cryptocurrency guide covers how active traders use MACD alongside other technical tools in real markets.
What Are the Best MACD Settings for Crypto?
On crypto daily and weekly charts, these settings still work well. Below that timeframe, the lag starts to become a meaningful problem.
- Standard (12/26/9): Best for swing traders and position traders using daily or weekly crypto charts. Good balance between sensitivity and noise filtering. The benchmark most platforms default to.
- Fast (5/13/5 or 6/13/5): Generates more signals with quicker response times. That means more opportunities, but also more false signals. Better suited to intraday crypto traders who need faster reaction times and are comfortable with higher signal noise.
- Slow (24/52/18): Fewer crossovers, but more significant when they occur. Some long-term Bitcoin investors use slower settings to filter out the daily volatility and focus only on major trend changes.
It’s worth testing any settings adjustment against historical price data before using it live. What works for Bitcoin on a 4-hour chart doesn’t necessarily apply to a lower-liquidity altcoin on the same timeframe, volatility differences are significant enough to matter.
When MACD Fails: Limitations You Need to Know
The most important thing to understand about MACD is that it’s a lagging indicator. It’s calculated from historical price data, moving averages of past closes, which means by the time a crossover appears on your chart, the price move has already begun. In a market where Bitcoin can gain 10% in a single session, MACD can confirm a trend right as it’s about to exhaust itself.
Sideways markets are where MACD produces the most noise. When price is consolidating between two levels without directional momentum, MACD oscillates across the zero line repeatedly, generating crossovers that lead nowhere and false signals that catch traders who aren’t checking broader context. This is the false-signal trap that costs most MACD beginners their first few trades.
“All technical indicators are based on past data. The question is never whether the signal is perfect — it’s whether it gives you a probabilistic edge over time.” — Jack Schwager, Author, Market Wizards
Three things MACD genuinely doesn’t do well:
- Predict exact entry and exit points. It tells you momentum direction. It doesn’t tell you where to place orders or when the move will end.
- Work reliably on very short timeframes. Signal lag is particularly damaging on 1-minute and 5-minute charts. The indicator was built for daily data.
- Account for external catalysts. A regulatory announcement, an exchange hack, or a major protocol upgrade can invalidate any technical setup instantly. MACD reads price; it can’t read news.
The Bottom Line on MACD Crypto Trading
MACD measures momentum, not direction — it tells you where trend strength is heading, not where price will go. Used on daily or weekly crypto charts with at least one confirming signal, it’s one of the more reliable momentum tools available. Used alone on a 5-minute chart during a consolidation phase, it’s mostly noise. The indicator works best when you understand it as one input in a multi-factor decision, not a standalone trading system. Crossovers identify potential trend shifts; divergences flag weakening momentum before price confirms; the histogram gives you real-time direction on momentum acceleration. That combination, used correctly, earns its place in most crypto trading setups.
Frequently Asked Questions
1. How accurate is the MACD indicator in crypto trading?
MACD’s accuracy depends heavily on market conditions and how it’s used. In trending markets, signal line crossovers reliably confirm direction. In sideways markets, the same signals produce frequent false positives. Most traders use MACD as one filter among several — combined with volume, RSI, or support and resistance levels — rather than as a standalone system. No single indicator is accurate enough to trade on its own in crypto’s volatile conditions.
2. What are the best MACD settings for Bitcoin specifically?
Most Bitcoin traders default to the standard 12/26/9 settings on daily or weekly charts, where the signals carry more weight. For shorter timeframes (4-hour or 1-hour), settings like 5/13/5 or 6/13/5 produce quicker responses but generate more false signals. There’s no universally “best” configuration — the right choice depends on your trading style and timeframe. Test any changes against historical Bitcoin data before committing to them live.
3. What is the difference between a MACD crossover and MACD divergence?
A crossover occurs when the MACD line crosses the signal line — a directional signal about the current trend. Divergence is a different concept entirely: it happens when MACD and price move in opposite directions, suggesting the current trend is losing structural momentum. Divergence is generally considered a higher-conviction signal, particularly for spotting reversals. Many traders combine both — using divergence for context and crossovers for entry timing.
4. Can MACD predict crypto price reversals?
MACD can suggest a reversal may be forming, particularly through divergence patterns, but it can’t predict reversals with certainty. Frame it as a momentum gauge rather than a predictive tool. A bearish divergence tells you momentum is fading at a price high — it’s a reason to reduce risk, not necessarily a signal to short immediately. Confirmation from price action (a break of support, a bearish engulfing candle) strengthens any reversal case considerably.
This content is for educational purposes only and does not constitute financial or investment advice. Crypto markets are highly volatile. Always conduct your own research before making any trading decisions.

Our Review Methodology
We evaluate each post based on thorough research, credibility of sources, accuracy of information, and relevance to our readers. Our editorial team follows strict guidelines to ensure all content meets high standards of quality.
Disclaimer
The content in this article is provided for informational purposes only and does not constitute financial, investment, or professional advice. Always do your own research before making any decisions.