Fibonacci retracement is a popular tool in technical analysis, plotting support/resistance levels at key ratios (23.6%, 38.2%, 50%, 61.8%, 78.6%) between a trend’s swing low and high. For crypto traders, mastering its correct use can help identify potential pullback zones in volatile uptrends or downtrends. This article provides detailed, step-by-step instructions for drawing Fibonacci retracements on crypto charts (both uptrends and downtrends), with platform-specific notes for TradingView and Binance. We explain the meaning of each common fib level (e.g. 61.8% “golden ratio” as a key support/resistance), summarize academic findings on fib effectiveness in crypto markets, and list common mistakes (wrong anchor points, using fib in ranges, etc.) and best practices for crypto traders. The guide includes six annotated chart examples (correct and incorrect drawings), a comparison table of fib levels vs. trader actions and risk rules, and sample Mermaid diagrams for decision workflow and trade timeline.
What Is a Fibonacci Retracement?
A Fibonacci retracement plots horizontal lines at percentage levels between two price extremes (swing low and swing high) on a chart. These lines correspond to ratios from the Fibonacci sequence (23.6%, 38.2%, 50%, 61.8%, 78.6%, plus 0% and 100% anchors). In an uptrend, the tool is anchored at the low and high of the move, and the lines act as potential support levels during pullbacks. In a downtrend, it’s anchored at the high and low, with lines acting as potential resistance levels. Traders use these fixed levels as predictive guideposts: many traders and algorithms watch the same fib levels, often creating self-fulfilling reactions. For example, TradingView’s documentation notes that “Fibonacci retracements act like traditional support and resistance” but are derived from mathematical proportions rather than price swings.
Common Fibonacci Levels and Their Interpretation
The key Fibonacci retracement levels in crypto trading are 23.6%, 38.2%, 50%, 61.8%, and 78.6%. Each has a typical market interpretation:
- 23.6% retracement: A very shallow pullback. Price holding near this level usually signals a very strong trend. In fast rallies, a 23.6% dip may occur before continuation. However, this level is often too small to reliably trade – price may “break through” easily. Traders rarely use it as a primary entry; it may serve as a partial exit (tight profit-taking) in a strong move.
- 38.2% retracement: The first moderate pullback level, often the first strong support zone in an uptrend. Crypto traders commonly watch for bounce signals at 38.2%. If price rallies from this level (especially with confirming volume or bullish candles), it is usually a sign the uptrend is intact. Thus, a bounce at 38.2% is a potential entry for trend continuation.
- 50% retracement: A psychological midpoint, not a Fibonacci ratio but widely included by traders. It represents half the prior move. In crypto (and other markets), many coins often pull back ~50% on sizable corrections. Holding above 50% typically suggests the original trend is still strong, whereas breaking below it may signal a deeper correction.
- 61.8% retracement: The “golden ratio” – the most watched level. It often acts as a powerful support/resistance pivot. Many traders place orders around 61.8%, and a bounce here is considered a high-probability sign of trend resumption. The region around 61.8–65% is called the “golden pocket,” where especially strong reversals can occur.
- 78.6% retracement: A deep pullback, almost a complete reversal. If price falls this far and then bounces, it may be the last chance for the original trend to resume. A break below 78.6% usually means the trend has likely ended and a new trend or range is forming.
- 100% retracement: Represents a full retracement (price returns to the swing start). Crossing this level invalidates the prior trend – at that point, traders typically conclude the move has failed.
In practice, these levels act more like zones than exact lines. For example, price often wicks slightly past a Fibonacci line before reversing. The important levels that most crypto traders watch are 38.2%, 50%, and 61.8%, as these are the “most common reversals”. According to one analysis, 38.2%–50%–61.8% are where retracements frequently halt. 23.6% is less often a turning point, and 78.6% is seen as a last-ditch area. When several levels align (for example, the 61.8% fib coinciding with a historical support), the effect is stronger.
Drawing Fibonacci Retracements – Step by Step
Correctly drawing the retracement lines is crucial. The general procedure on any chart is:
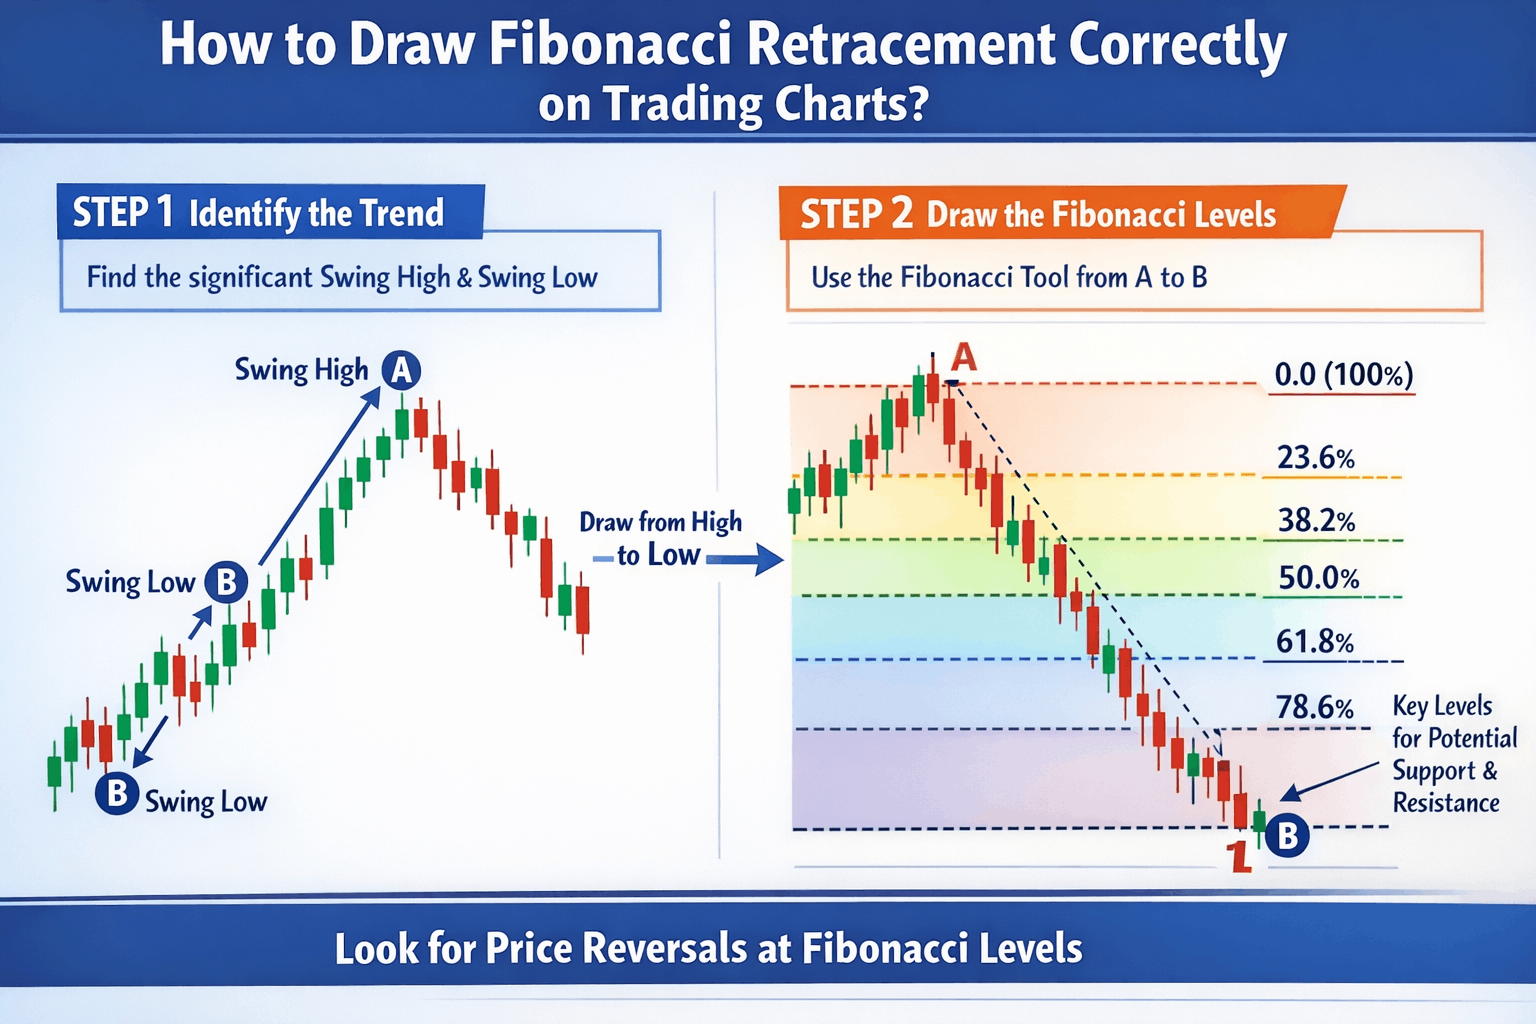
- Identify a clear swing high and swing low over the move you are analyzing. These should be significant pivots (major peaks and troughs). For example, if Bitcoin rallied from $20,000 to $25,000, you would use $20K (swing low) and $25K (swing high).
- Draw the fib tool between those two points. In an uptrend, click on the swing low first and drag up to the swing high. In a downtrend, click the swing high then drag down to the swing low. This sets 0% at one end and 100% at the other.
- Check the orientation. On an uptrend, the fib lines (23.6%, 38.2%, etc.) descend from the high down to the low (so 23.6% is near the top). In a downtrend, they ascend from the low up to the high. Ensure that 0% and 100% are at the correct extreme points. If drawn backwards, the levels will be inverted and wrong.
- Confirm levels. Most charting platforms (TradingView, Binance) will automatically plot default levels (23.6%, 38.2%, 50%, 61.8%, etc.). You can adjust the settings to show additional ratios (e.g. 78.6%, extensions). For example, on TradingView you can enable or disable levels in the tool’s settings.
Platform-Specific Tips (TradingView and Binance)
TradingView
- TradingView’s Fibonacci Retracement tool is built-in and highly configurable.
- Drawing: Click once at the swing low and release at the swing high for an uptrend (or vice versa for a downtrend).
- Customization: You can toggle which fib levels to display.
- Visual Style: The tool automatically draws horizontal lines and level labels.
- Using Log Scale: For very large price moves, you may switch the chart to logarithmic scale for accuracy.
- Saving Tool: If fib is not in your favorites, click the star to add it for quick access.
Binance (Mobile/App)
- The Binance app uses TradingView charts on mobile. To draw fib on Binance: go to Markets → Trade pair → Chart view. Then tap the drawing icon and select “Fibonacci Retracement”.
- Drawing: Tap on the swing point where you want 0% to be and drag to the opposite swing point.
- Observation: After drawing, the horizontal fib levels will appear immediately.
- Tips: On mobile, zoom/scroll as needed to precisely place anchors.
Statistical Evidence in Crypto Markets
Academic and industry studies suggest mixed performance of Fibonacci in crypto markets. One recent analysis of energy cryptocurrencies found that fib levels tend to capture stock price moves better than crypto moves. In other words, crypto’s higher volatility led to more frequent fib “breakouts” than in traditional stocks. For example, during downtrends the study observed many more violations of fib levels (levels being broken) compared to uptrends. It noted that in crypto downtrends the 23.6% level was often the first to break, indicating fibs were less reliable on violent sell-offs.
Another study comparing fib trades to buy-and-hold in crypto found that a Fibonacci-based strategy did outperform a naïve hold strategy. However, even that research emphasized that fib systems work “significantly better” in stocks versus energy cryptos, and that many price violations occurred, especially on downswings. In summary, statistical evidence urges caution: Fibonacci levels are watched by many traders (which gives them some self-fulfilling power), but crypto’s choppiness means levels are often pierced unless confirmed by strong context.
Best-Practice Checklist for Crypto Traders
For reliable Fibonacci analysis in crypto, follow this checklist:
- Confirm a Clear Trend: Ensure the price is in a well-defined uptrend (higher highs/lows) or downtrend before applying fib. Look for breakouts or channel patterns as confirmation.
- Use Significant Swings: Identify the dominant swing low and high that bracket the move. Use extreme points (full candle wicks) as anchors. Avoid tiny intra-day zigzags.
- Draw Correctly: In an uptrend, draw fib from low to high; in a downtrend, high to low. Check that 0% is at the swing start and 100% at the end.
- Watch Key Levels: Focus on the main fib zones (38.2%, 50%, 61.8%) and optionally 78.6%. These are the most relevant pullback targets.
- Multi-Timeframe Confluence: See if fib levels line up with other factors (e.g. a 61.8% fib on 4h and daily both around the same price). A price level that is both a fib and a historical support/resistance is stronger.
- Candlestick & Indicator Confirmation: When price approaches a fib level, wait for a reversal pattern (hammer, engulfing) or an oscillator signal (RSI oversold/overbought) before entering.
- Set Stops Wisely: Place your stop-loss just beyond the next fib level that would invalidate your trade (e.g. below 61.8% if entering at 50%). This protects you if the retracement continues deeper.
- Plan Targets: Identify exits at higher fib levels or extensions. For an uptrend bounce, common targets are the 38.2% fib (partial profit) and 0%/swing high (full move). Use fib extensions (e.g. 161.8%) for long-run targets.
- Size for Depth: Scale your position size to retracement depth. A trade at a shallow 38% pullback can generally risk more, whereas entering at a deep 78% retracement should use a smaller position (since the trend is weaker).
- Use Time & Price Confirmation: Only trade fib bounces after they occur. Don’t enter preemptively. For example, wait to see if price actually reacts at 61.8% before buying. If price slices through without reaction, bail out.
- Avoid Major News: Skip fib trades during high-impact events (e.g. FOMC, NFP) in crypto, as violent moves can ignore technical levels and stop you out prematurely.
Following this regimen—trend check, proper anchors, confirmation, stops/targets—helps crypto traders use Fibonacci retracements as part of a disciplined strategy.
Conclusion
Fibonacci retracement is still one of the most popular technical analysis tools in all kinds of financial markets, from traditional forex trading to modern crypto trading. When used correctly, the Fibonacci retracement tool can help traders find possible support and resistance levels where price changes are more likely to happen. These levels—23.6%, 38.2%, 50%, 61.8%, and 78.6%—give you a way to look at market pullbacks that are happening in the middle of a trend.
You should never use Fibonacci retracement on its own. To make better decisions, professional traders often use these levels with trendlines, moving averages, market structure, or momentum indicators. Paul Tudor Jones, a famous trader, once said, “The secret to being successful as a trader is to have an insatiable and unending thirst for information and knowledge.” Fibonacci retracement levels give you a structured way to see how markets move and then go back before continuing a trend.
Our Review Methodology
We evaluate each post based on thorough research, credibility of sources, accuracy of information, and relevance to our readers. Our editorial team follows strict guidelines to ensure all content meets high standards of quality.
Disclaimer
The content in this article is provided for informational purposes only and does not constitute financial, investment, or professional advice. Always do your own research before making any decisions.