Everyone watching Bitcoin in late 2024 was watching the same thing: whether $100,000 would hold. After months of climbing, BTC hit that round number in December and traders who had marked it as key resistance for over a year were vindicated. Some sold into it. Others waited to see if it would flip to support. It did. This whole dynamic of price stalling, reversing, testing, eventually breaking through is exactly what support and resistance describes.
It’s not a complex concept, but it’s one of the most genuinely useful tools in technical analysis. Get it right and you have a framework for entries, exits, and stop losses. Get it wrong and you’re guessing.
This guide covers what support and resistance levels are in crypto, five methods for finding them on any chart, how to trade them, and the mistakes that trip up beginners.
Support is a price floor where buying pressure historically stops a decline. Resistance is a ceiling where selling pressure stops a rally. Find these levels using swing highs/lows, round numbers, moving averages, Fibonacci retracement, and pivot points. The more times a level is tested, the more significant it becomes.
What Are Support and Resistance Levels in Crypto?
Support and resistance are price zones where supply and demand repeatedly cause reversals or consolidation. Support is the floor, a level where enough buyers enter the market to halt a decline and push price back up. Resistance is the ceiling, a level where sellers dominate and cap upward movement.
These aren’t arbitrary lines. They reflect the collective behaviour of market participants who’ve traded at those prices before. Traders who bought near support expect it to hold again. Traders who sold near resistance will often sell there again.
How Support Levels Form
Support forms when price has repeatedly bounced from a particular zone. Think of it as accumulated demand. When BTC fell to roughly $25,000 in mid-2023 and held there multiple times, that level became recognisable support — not because of math, but because a significant number of traders treated it as fair value and bought.
Each successful bounce reinforces the level. More traders note it. Stop orders cluster above it. The self-fulfilling nature of technical analysis gets a bad press, but the underlying mechanism is real: when enough participants watch the same level, their collective actions make it meaningful.
How Resistance Levels Form
Resistance forms at price levels where sellers have historically overwhelmed buyers. It’s often where traders who bought lower want to lock in profits, or where those who bought at higher prices during a previous peak are waiting to “get out even.”
Bitcoin’s path to $100,000 is a clean example. The $69,000 level from the November 2021 peak acted as resistance for nearly three years. Every time BTC approached it, sellers who’d been underwater since that peak had the opportunity to exit. This is how I see it after studying multiple studies. It took sustained institutional demand — partly from the spot ETF approval in January 2024 — to absorb all that selling and push through.
Why Crypto Markets Respect These Levels
You might expect support and resistance to matter less in crypto than in traditional markets. The opposite is often true. A few reasons for this.
- Retail-driven psychology amplifies round numbers. In equity markets, institutional algorithms dominate. In crypto — even post-ETF — retail participation is still much higher as a percentage of volume. Human psychology gravitates toward round numbers. $10,000. $50,000. $100,000. More traders cluster orders around these levels, which makes them more meaningful than they’d be purely on merit.
- The 24/7 trading cycle creates distinct liquidity pockets. Traditional markets reset overnight. Crypto doesn’t. That means thin liquidity during weekend hours — and thin liquidity means price can spike through levels and then snap back, creating wicks that traders often misread. Understanding this helps avoid getting shaken out of legitimate setups.
- Volatility is structural, not accidental. Crypto moves 5-10% in a session the way equities move 0.5-1%. That sounds risky, but it also means support and resistance levels are tested more frequently. You get more data points, faster. A level that holds three tests in a week on BTC would take a month to validate on most large-cap stocks.
“The most important price levels are not the ones your indicator draws — they are the ones every participant in the market already knows. Round numbers, prior highs, prior lows. Those are the levels where the crowd acts, and the crowd is what moves price.” — Mark Douglas, Author, Trading in the Zone
And then there’s fundamental analysis, which can either reinforce technical levels or override them entirely. When on-chain data shows large holders accumulating at a specific zone, it adds conviction to what the chart is already showing.
How to Find Support and Resistance in Crypto Charts
There are five main methods. Most experienced traders use several in combination — that confluence is where the reliable levels live.
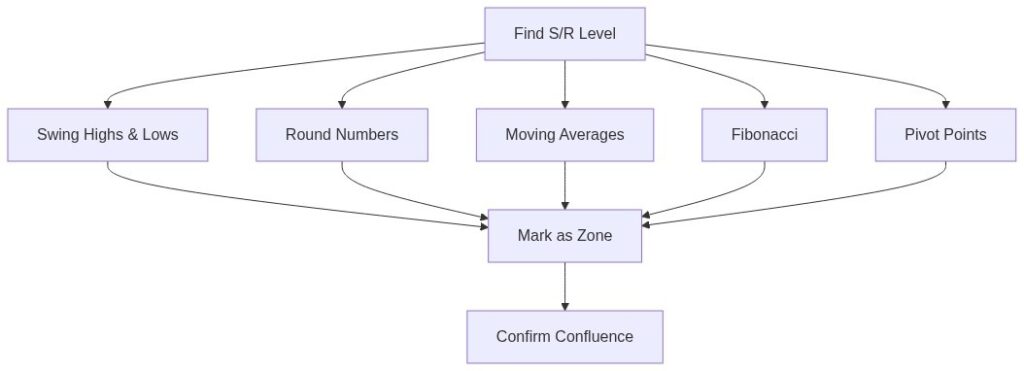
1. Historical Swing Highs and Lows
Start here. Zoom out to a weekly or monthly chart and look for the obvious turning points — peaks where price reversed lower (resistance) and troughs where it reversed higher (support). These are the anchors. Everything else layers on top.
The rule of thumb: the more times a level has been tested without breaking, the stronger it is. A single touch is just a data point. Three or four bounces from the same zone? That’s a level worth respecting. Mark it as a zone, not a line — price rarely reverses at exactly the same pixel twice.
2. Round Numbers and Psychological Levels
$10,000. $20,000. $30,000. $50,000. $100,000. In Bitcoin’s history, every one of these levels has acted as meaningful support or resistance. The psychology is simple: traders anchor to round numbers because they’re easy to remember and easy to set orders at.
The effect is well-documented across currency and equity markets. By this, I mean human traders anchor to round numbers because they’re simple reference points, not because the math demands it. In crypto, it’s amplified: higher retail participation and a 24-hour market cycle mean those psychological clusters form faster and hold more weight than in traditional markets.
This is worth treating as its own method rather than folding into general historical analysis. When a round number coincides with a prior swing level — as $100,000 did for Bitcoin in December 2024 — you get confluence, and those are the levels institutional traders tend to take most seriously.
3. Moving Averages as Dynamic Levels
Moving averages don’t give fixed price levels — they move with the market. That’s what makes them useful as dynamic support and resistance. The 200-day moving average has acted as Bitcoin’s long-term support throughout multiple market cycles. Drop below it and you’re in bear territory (historically). Reclaim it and the trend often resumes.
For shorter timeframes, the 50-day and 21-day MAs often act as intraday or weekly levels. The key concept is that when price approaches a widely watched moving average, market participants who use that MA as a reference point will cluster their orders there. That concentration of orders creates the support or resistance effect.
Don’t use just one MA. Watch where several converge — when price is approaching the 50-day and the 200-day at the same time (the “death cross” or “golden cross” zones), those regions carry outsized weight.
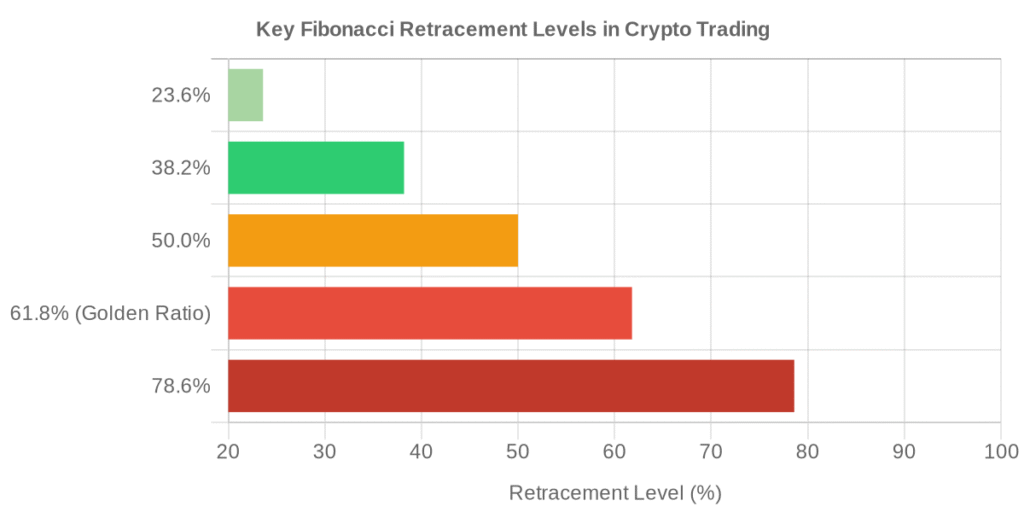
4. Fibonacci Retracement
Fibonacci levels are derived from mathematical ratios found throughout nature: 23.6%, 38.2%, 50%, 61.8%, and 78.6%. The 61.8% level — known as the “golden ratio” — is the one most traders treat as a high-probability support or resistance zone after a significant price move.
The practical process: identify a significant high and a significant low (or vice versa). Apply the Fibonacci retracement tool from one extreme to the other. The key levels (particularly 38.2%, 50%, and 61.8%) often correspond to where price pauses, consolidates, or reverses during a correction.
I have a real example to share here: in early 2024, Bitcoin rallied from approximately $42,000 to $58,800. It then corrected, pulling back to the 61.8% retracement level near $48,400 — where it found support and resumed its uptrend (multiple TA sources, 2024). Fibonacci didn’t predict this. But enough traders watching the same level bought there that it became meaningful.
5. Pivot Points
Pivot points are mathematically calculated from the prior period’s high, low, and closing price. Standard formula: Pivot = (High + Low + Close) / 3. From there, you derive three support levels (S1, S2, S3) and three resistance levels (R1, R2, R3).
They’re most useful as daily or weekly benchmarks — the kind of levels algorithmic traders and market makers reference. When you see price dip to an S1 or S2 and bounce, that’s often institutions buying at known levels, not coincidence.
Support and Resistance Zones vs. Lines: Which Approach Works?
Most beginners draw single lines. That’s fine for getting started, but it misrepresents how price actually behaves. Support and resistance exist as zones — ranges of 1-3% on either side of the headline level — not razor-thin lines.
Why does this matter? Because price doesn’t reverse at exactly the same point twice. It overshoots, it undershoots, it wicks through and comes back. If you draw a single line at $45,000 and treat any candle that closes below it as a “break,” you’ll get shaken out of legitimate setups constantly.
Draw zones instead. If a level around $45,000 has been tested multiple times, mark a range from roughly $44,200 to $45,800. Price entering that zone is meaningful. Price closing convincingly below that zone is a break. That distinction filters out noise — and in crypto, there’s a lot of noise.
Which method is more accurate? Neither in isolation. A zone provides better context than a line, but the real accuracy comes from confirmation: what is price doing in the zone? Is volume increasing on the rejection? Is there a clear reversal candle? Zones tell you where to watch. Price action tells you what to do.
What Happens When a Level Breaks? (Role Reversal)
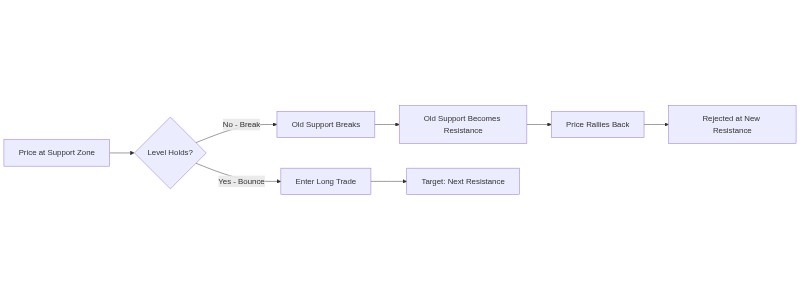
This is one of the most useful — and underused — concepts in technical analysis. When a support level breaks convincingly, it often flips to resistance. Old buyers who held through the break are now underwater and will likely sell when price rallies back to their entry zone. That selling turns former support into a ceiling.
The reverse is also true. When price breaks through resistance, that former ceiling often becomes support on the next pullback. Buyers who missed the initial breakout will step in at the old resistance level, providing a bid.
BTC’s $69,000 level is instructive here. It was the all-time high from November 2021, acting as significant resistance throughout 2022 and 2023. When Bitcoin finally broke above it in early 2024, that level — once a ceiling — began acting as support during pullbacks. Traders who watched that transition and bought the retest to $69,000 caught a compelling entry.
The rule for using role reversals: the stronger the original level (more tests, longer time in play), the more reliable the flip tends to be. A level tested once? Less reliable. A level tested six times over two years? The flip carries real weight.
The trade that made role reversal click for me was Bitcoin’s reclaim of $69,000 in early 2024. I’d been watching that level for almost two years; it was the November 2021 all-time high, and it had rejected every rally since. When BTC finally broke above it in February 2024, I didn’t chase the breakout. Instead, I waited for the pullback to $69,000 and watched how the price behaved when it returned to that zone. It held a clean bounce, volume came in, no close below. That retest entry ended up being one of the better-managed trades of that cycle for me. The level that had stopped every rally for two years became the floor.
How to Trade Crypto Support and Resistance
Understanding support and resistance is one thing. Knowing when to act on it is another. Two primary strategies dominate.
The Bounce Trade
You’re betting the level holds. Price approaches support, shows signs of reversal (bullish candle formation, volume spike, oversold oscillator reading), and you enter long. Stop goes just below the support zone. Target is near the next resistance level.
This works best when the level has held multiple times before and when there’s additional confluence — for example, price is near the 61.8% Fibonacci level AND near the 200-day moving average AND near a round number. Triple confluence like that is genuinely high-probability.
The mistake beginners make: entering too early, before the bounce is confirmed. Watching price drift slowly into a support zone and buying as soon as it touches means your stop is far away (under the zone) and the signal hasn’t confirmed. Wait for the reversal candle. Accept that you’ll miss the very bottom. That’s the trade-off for higher-probability entries.
The Breakout Trade
You’re betting the level fails. Price approaches resistance multiple times, each bounce getting weaker. Then it breaks through with conviction — ideally on above-average volume. You enter after the breakout and a brief retest of the broken level.
Fake breakouts are the bane of this strategy. Price pokes through resistance, trips the stops of late shorts, then reverses sharply. The filter: wait for a candle close above resistance, not just an intrabar spike. And check volume — real breakouts typically see volume expand. A breakout on declining volume is suspect.
In my experience watching Bitcoin’s range in late 2024, the $74,000 level that had been resistance since the March 2024 high eventually broke on surging volume when institutional flows accelerated post-US election. The move was decisive and didn’t look back for weeks.
“Old resistance becomes new support and old support becomes new resistance. This principle works because markets have memory — the participants who traded at those levels still remember them, and they act accordingly when price returns.” — John Murphy, Author, Technical Analysis of the Financial Markets
How to Use Key Levels for Stop Losses and Profit Targets
Support and resistance aren’t just for entries. They’re arguably more valuable for risk management.
- Stop loss placement: For long trades from support, your stop goes below the support zone (not inside it). If the zone is $44,200-$45,800, your stop might sit at $43,800 — far enough below to filter out noise, but close enough that a genuine break invalidates your thesis. For short trades from resistance, the reverse applies: stop above the zone.
A common beginner mistake is placing stops exactly at the level. Price often wicks through the level before reversing, taking out those stops before continuing in the original direction. The zone concept solves this: you’re stopped out when the zone is decisively violated, not when price briefly touches the line.
- Profit targets: Measure from your entry to the next significant support or resistance level. If you’re long from $45,000 with a next resistance at $52,000, that’s your initial target. You might scale out — take half at $52,000 and let the rest run if momentum holds.
The risk-reward math matters here. If your stop is $1,200 below entry and your target is $7,000 above, that’s roughly a 5.8:1 ratio. Decent. If those numbers were reversed, the trade doesn’t make sense regardless of how good the setup looks.
Common Mistakes When Trading Support and Resistance
- Treating every level equally: A level touched once in a fast-moving market is not the same as a level tested six times over eight months. Weight your confidence accordingly.
- Ignoring higher timeframes: A support level on a 5-minute chart means very little if daily and weekly charts show you’re in a strong downtrend. Always check the higher timeframe context before trading a level on a lower one.
- Over-drawing: Some traders mark every minor swing high and low until the chart looks like it got attacked with a ruler. Discipline yourself to mark only the levels that are obviously significant — the kind any experienced trader would identify without thinking. If you have to squint to justify a level, skip it.
- Trading the level the same way every time: A level doesn’t just hold or break. The manner of approach matters. Price drifting slowly into support after a prolonged decline behaves differently than price crashing violently into the same level. Read the price action, not just the level.
- Ignoring the cost of being wrong: Support and resistance are probabilistic tools. They work most of the time — but crypto is full of black swan events, exchange hacks, regulatory announcements, and whale manipulation that can send price through any level without warning. Always size positions so that a stop being hit doesn’t significantly damage your account.
Support and Resistance in Crypto: The Bottom Line
Support and resistance mark the price zones where supply and demand have historically intersected — the levels where crypto markets tend to stall, reverse, or break out. Finding them accurately requires combining historical swing levels with psychological round numbers, moving averages, Fibonacci ratios, and pivot points. The more methods that point to the same zone, the stronger the level.
What makes these levels matter in crypto specifically is the mix of retail psychology and thin weekend liquidity that amplifies reactions. Bitcoin’s $100,000 level wasn’t significant because of a formula — it was significant because millions of traders treated it as a milestone.
Start by marking the obvious levels on weekly and daily charts. Add Fibonacci and moving averages. Watch how price behaves in those zones. The read improves with practice, not theory.
Frequently Asked Questions
1. What is the difference between support and resistance zones vs. lines?
Lines are single price points. Zones are ranges (typically 1-3% wide) where support or resistance is active. Zones are more accurate because price rarely reverses at exactly the same price twice — it overshoots, wicks through, or consolidates in a range before reversing. Trading zones over lines significantly reduces getting shaken out by normal price noise.
2. How many times should a level be tested before trading it?
Most experienced traders want to see a minimum of two or three tests at the same zone before treating it as a reliable level. One touch is just a data point. Two bounces suggest coincidence. Three or more establishes a pattern. That said, time also matters — a level tested three times over three years carries more weight than three tests in three days.
3. Does support and resistance actually work in crypto?
It works, but not perfectly. Support and resistance are probabilistic, not deterministic. Levels fail regularly — especially during high-impact news events, exchange liquidation cascades, or major shifts in market structure. The edge comes from confluence (multiple methods pointing to the same zone), proper position sizing, and treating every support/resistance trade as a hypothesis to test, not a certainty.
4. What happens when price breaks through a support level?
Two things can happen. First, the support may be momentarily broken but then reclaimed — a “wick through” that clears out stop orders before buyers defend the level. Second, the break may be genuine, in which case old support often flips to resistance. The way to distinguish them: wait for a candle close below the zone (not just a wick), check volume, and assess the broader market context.
5. What is the best timeframe for finding support and resistance in crypto?
Start with the weekly or daily chart to identify the major levels — these carry the most weight because they’re visible to the most participants. Then drop to a 4-hour or 1-hour chart for entry timing. Using multiple timeframes together (top-down analysis) is more reliable than relying on any single timeframe. The monthly chart is worth checking for major structural levels, especially on Bitcoin and Ethereum.
This article is for educational purposes only and does not constitute financial or investment advice. Cryptocurrency trading involves substantial risk of loss.
Our Review Methodology
We evaluate each post based on thorough research, credibility of sources, accuracy of information, and relevance to our readers. Our editorial team follows strict guidelines to ensure all content meets high standards of quality.
Disclaimer
The content in this article is provided for informational purposes only and does not constitute financial, investment, or professional advice. Always do your own research before making any decisions.