If you’ve spent any time on crypto Twitter, TradingView, or any trading forum, you’ve seen the RSI Indicator mentioned approximately every five minutes. Someone is calling a bottom because “RSI is oversold.” Someone else is shorting because “we’re in overbought territory.” A third person insisting divergence just flashed — this is it, the reversal is happening.
The RSI is, genuinely, one of the most useful momentum indicators available. But it’s also one of the most misunderstood tools in a retail crypto trader’s kit, and the gap between “I know what RSI is” and “I actually trade with RSI effectively” is wider than most tutorials let on.
This guide covers both sides of that gap.
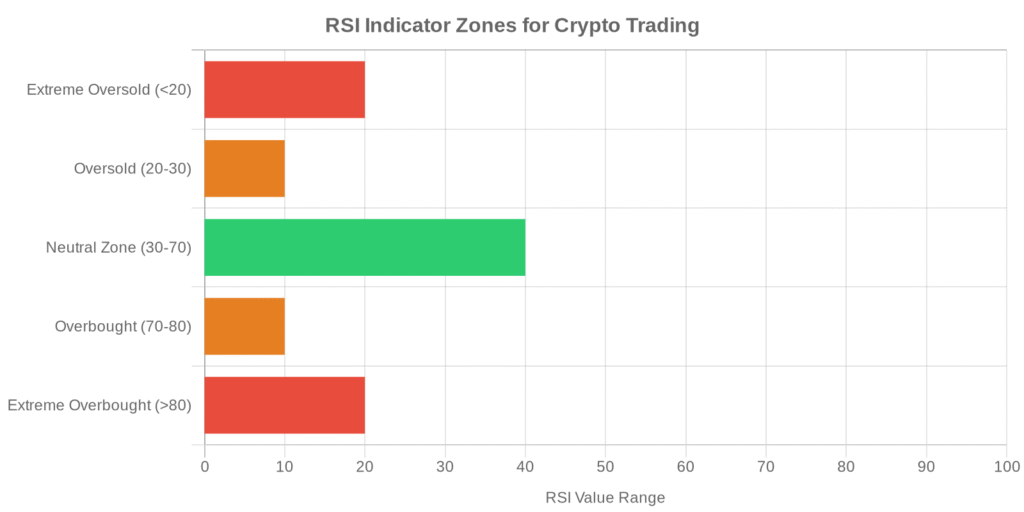
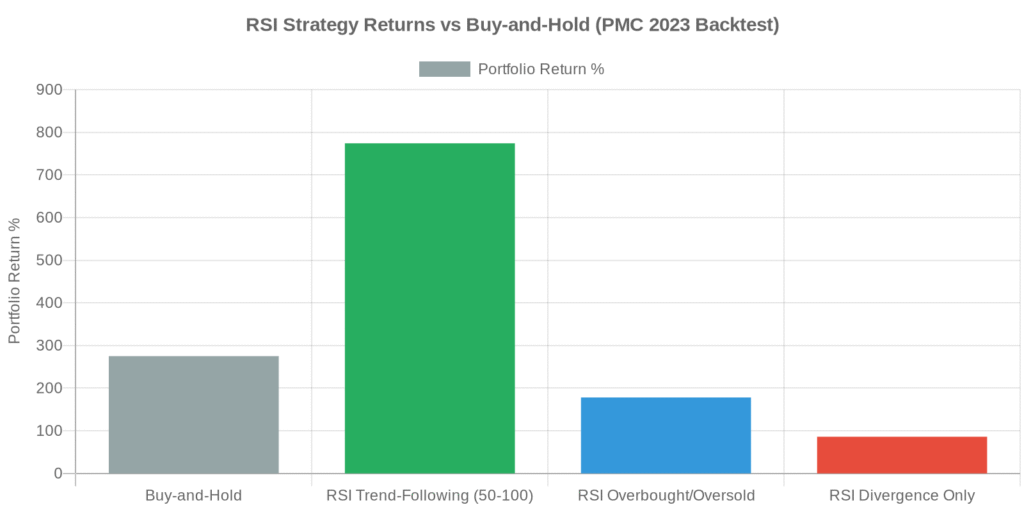
The RSI (Relative Strength Index) measures momentum on a 0–100 scale. Readings above 70 signal overbought conditions; below 30 signals oversold. In crypto, these thresholds often shift to 80/20 because of higher baseline volatility. A 2023 peer-reviewed study found that using RSI as a trend-following tool (signals above 50 = bullish) achieved 773.65% portfolio returns versus 275.22% buy-and-hold across 10 cryptocurrencies (PMC, 2023). The default 14-period setting works best on 4H and daily charts.
What Is the RSI Indicator? (And Why Crypto Traders Obsess Over It)
The Relative Strength Index (RSI Indicator) Chart measures the speed and magnitude of recent price movements, generating a reading between 0 and 100. J. Welles Wilder Jr. developed it in 1978 and published it in New Concepts in Technical Trading Systems, originally for commodity futures, long before crypto existed as a concept.
The reason traders obsess over it is simple: it answers a question every position has. Is this asset running out of steam, or is the momentum still behind it? At 70+, the market has been buying aggressively; at 30 and below, selling has dominated. The RSI gives you a calibrated number for that pressure rather than just a vibes check.
What makes RSI particularly relevant for crypto versus, say, equities is that crypto markets run 24/7, move faster, and spike harder. December 2025, Bitcoin’s daily RSI hit 89 as the price rallied toward its cycle highs. March 2026, amid a broader correction, it dropped to 22. That kind of range is unusual in traditional markets. In crypto, it’s not rare at all.
I’d also point out: RSI was built for markets with more predictable cycles. Crypto has those cycles, but they’re compressed and amplified. That changes how you apply the tool, which we’ll get into shortly.
How the RSI Formula Actually Works
RSI isn’t magic. It’s math, and understanding the math changes how you interpret the output.
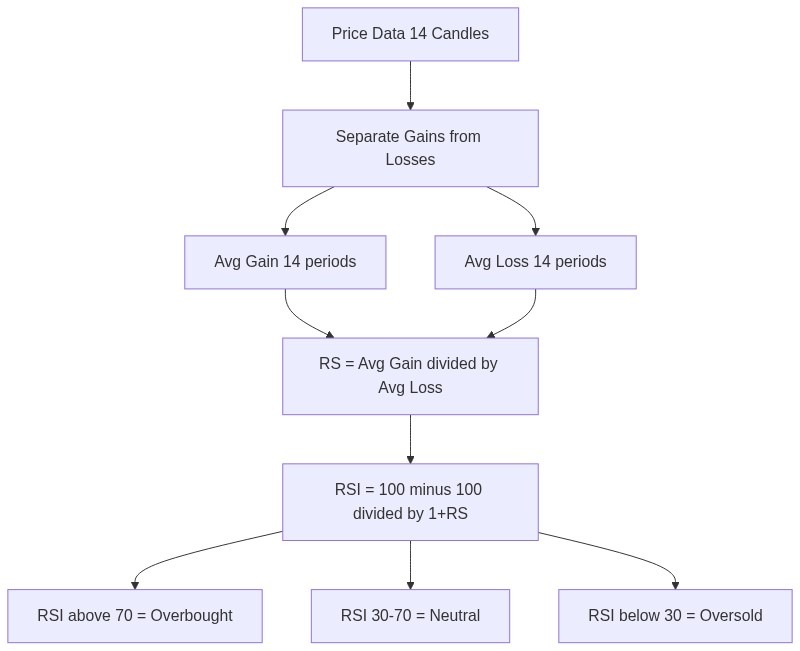
The formula: RSI = 100 – [100 / (1 + RS)]
RS (Relative Strength) is the ratio of average gains to average losses over a lookback period by default, 14 candles. So on a 4-hour chart, you’re looking at 14 four-hour periods. On a daily chart, 14 days. The RSI calculation essentially asks: over the last 14 periods, what proportion of price movement was upward versus downward?
One practical implication
The RSI responds to the pace of moves, not just direction. A slow, steady climb might produce a lower RSI than a sharp three-day spike upward. That’s intentional. Wilder wanted to capture the intensity of price action, not just whether a market was going up or down.
The 14-period default isn’t sacred. It’s where Wilder found the best signal-to-noise ratio for his original commodities work. Traders adjust it constantly, shorter periods (7, 9) for more sensitivity, longer periods (21, 25) to smooth out noise. More on that in the settings section.
How Do You Read RSI in Crypto Trading?
The classic interpretation is familiar: above 70 means overbought, below 30 means oversold. What’s less discussed is how often those thresholds mislead traders in crypto specifically.
During the 2021 bull run, Bitcoin’s weekly RSI spent months above 70. If you sold every time it crossed that line, you exited one of the most profitable runs in the asset’s history. The indicator wasn’t wrong, it was correctly flagging sustained buying pressure. The mistake was treating “overbought” as “about to reverse” rather than “strong momentum.”
RSI Logic for Crypto
For crypto, particularly during trending markets, many experienced traders shift those levels to 80 (overbought) and 20 (oversold). The logic: crypto’s higher volatility means RSI naturally spends more time at extremes. Tighter thresholds reduce false signals without sacrificing too many real ones.
The 50 midline gets far less attention than it deserves. RSI holding consistently above 50 is a bullish trend signal, buyers are in control on average. RSI unable to break above 50 during attempted rallies? That’s a weak market even if the price is still moving up. It’s the difference between momentum confirming a trend and momentum quietly running out of steam.
Three key readings to know:
- RSI crossing from below 30 upward: potential oversold bounce signal. More meaningful when it happens quickly after a sharp selloff, less meaningful when RSI has been grinding around 30 for weeks.
- RSI crossing from above 70 downward: potential overbought exhaustion. Again, context matters. A slow fade from 72 is different from a sharp drop from 85.
- RSI holding above 50 on a pullback: one of the stronger trend continuation is rsi indicator buy and sell signals. The asset dipped, but buyers stepped in before RSI could break the midline.
None of these work in isolation. RSI is a momentum tool, not an oracle. It describes what’s been happening; your job is to decide whether that pattern continues.
What Is RSI Divergence And Why It’s Harder Than It Looks
RSI divergence is where things get interesting, and also where a lot of traders trip up.
- Bullish divergence: Price makes a lower low, but RSI makes a higher low. Translation: the selling pressure behind the latest price drop is weaker than the one before it. Momentum is deteriorating on the sell side which is a potential reversal signal.
- Bearish divergence: Price makes a higher high, but RSI makes a lower high. Translation: the buying pressure behind the latest rally is weakening. The price got to a new high, but with less conviction behind it.
I spotted a clean bullish divergence on ETH/USDT in late 2025 — price carved a lower low around $2,800, but the RSI low came in higher than the previous trough at around $3,100. The divergence was obvious on the 4H chart. I entered with a tight stop just below the new price low. The trade worked, but only because I had volume confirmation and the broader market wasn’t in free fall. I’ve seen the same setup fail just as often when macro conditions weren’t supportive.
That’s the uncomfortable reality about divergence: it occurs in only 0.8% of candles, according to the 2023 backtesting study published in PMC (Effectiveness of the Relative Strength Index Signals in Timing the Cryptocurrency Market, PMC 2023). For context, the long-only divergence strategy in that study produced just 86.15% portfolio returns versus 275.22% from simple buy-and-hold. Not great. The research describes divergence signals as “uneven and concentrated in underperforming assets” which is a polite way of saying they often show up in the wrong places.
Divergence isn’t useless. I do use it. But it works better as a warning flag than as a standalone entry trigger; something that prompts you to tighten a stop or reduce size, rather than a green light to enter a full position.
Hidden divergence: less covered, arguably more useful. Bullish hidden divergence: price makes a higher low, RSI makes a lower low. This signals trend continuation, not reversal. It’s showing that even though momentum dipped temporarily, the underlying uptrend is still intact. I find this cleaner to trade than classic divergence because you’re going with the trend rather than calling a reversal.
Best RSI Settings and Timeframes for Crypto
The default 14-period RSI on a 4-hour or daily chart is where most crypto traders start, and for good reason; it balances responsiveness with noise reduction at the timeframes where most meaningful setups form.
Where it gets more nuanced:
- For scalping (1M–15M charts): Many scalpers drop to RSI 7 or RSI 9. Faster period = more signals, more noise. If you’re trading on a 1-minute chart, the 14-period RSI reacts slowly enough to be almost useless for fast entries. RSI 7 keeps pace. The tradeoff is more false signals — you’ll need additional filters, typically price action confirmation or volume.
- For swing trading (4H–daily): RSI 14 is still the standard, and it’s hard to argue against it for BTC, ETH, and major altcoins. For day trading cryptocurrency on shorter timeframes, consider dropping to RSI 9 on the 1H to get more actionable readings.
- For long-term position trades (weekly): RSI 21 or RSI 25. Slower. Fewer signals, but they carry more weight. Weekly RSI touching 30 on Bitcoin has historically been a noteworthy moment, it happened in bear market bottoms in 2018, 2020, and the broader 2022 cycle low.
One thing worth noting about altcoins specifically: lower liquidity means RSI spikes are more extreme and more frequent. A meme coin or low-cap token hitting RSI 85 doesn’t carry the same weight as Bitcoin at the same level. The indicator is more reliable on assets with deep, liquid order books where RSI extremes take real sustained buying or selling pressure to produce.
RSI Strategies That Work in Crypto (With Evidence)
Most RSI guides describe the overbought/oversold strategy as if it’s the primary use case. The research suggests otherwise.
The PMC 2023 backtest across 10 cryptocurrencies (2018-2022) found that using RSI as a trend-following indicator dramatically outperformed the classic overbought/oversold approach. The modified strategy — treating RSI above 50 as a bullish signal and staying long achieved 773.65% portfolio returns against 275.22% buy-and-hold. The traditional overbought/oversold approach generated only 177.7% long-only. (PMC, 2023)
“The most common mistake traders make with momentum indicators is treating a high reading as a reason to sell and a low reading as a reason to buy. In a strong trend, overbought stays overbought. The indicator is telling you about strength, not exhaustion.” — J. Welles Wilder Jr., Developer of RSI, New Concepts in Technical Trading Systems (1978)
Three approaches worth knowing:
Strategy 1 — RSI Trend Following (the one that actually works)
Buy when RSI crosses above 50. Hold as long as RSI stays above 50. Exit when RSI breaks back below 50. It sounds almost too simple. The logic: RSI above 50 means buying pressure is dominant on average over your lookback period. You’re riding momentum, not trying to call reversals.
The catch: you give back gains on RSI dips. In a choppy, ranging market, RSI will whipsaw around 50 repeatedly, generating a string of small losses. This strategy performs best in trending markets — which, for major crypto assets, describes a meaningful portion of the time.
Strategy 2 — Oversold Bounce with Confluence
Wait for RSI to drop below 30 (or 20 in volatile markets), then look for a confirmed bounce — RSI crossing back above 30, ideally with a bullish candle close and volume uptick. Don’t enter on the touch of 30 alone. Wait for confirmation.
The combination matters here. If you’re also seeing a support level hold, MACD beginning to curve upward, and RSI bouncing, those three signals together are worth more than any one in isolation. Breakout trading strategies often pair well with RSI oversold entries which is a breakout from a consolidation zone where RSI has been recovering from oversold is a high-probability setup.
Strategy 3 — RSI Divergence as a Position Management Tool
Rather than using divergence as an entry signal, use it to manage existing positions. If you’re long and see bearish divergence developing (price making new highs, RSI making lower highs), that’s a reason to tighten your stop or trim position size — not necessarily to reverse. Think of it as an early warning indicator, not a trading signal.
Some traders use automated trading bots to monitor RSI levels continuously and trigger alerts when divergence patterns emerge, which at least removes the manual effort of watching every chart.
The RSI Mistakes That Cost Traders Real Money
- Treating every overbought signal as a sell trigger: This one’s common enough to be worth emphasizing. RSI above 70 during a bull trend tells you momentum is strong which is often exactly when you want to be holding, not selling. Selling BTC at RSI 72 in early 2021 because “it’s overbought” cost people significant returns. In trending markets, overbought RSI is confirmation of the trend, not a reversal warning.
- Using RSI alone: RSI has no information about volume, support/resistance levels, news events, or on-chain data. An oversold RSI during a catastrophic exchange collapse (see FTX, November 2022) is not a buy signal. Context from multiple sources is non-negotiable.
- Ignoring which timeframe RSI is on: RSI can be oversold on the 15-minute chart while the daily trend is clearly bearish. These readings aren’t contradictory — they’re just measuring different things. Shorter timeframe RSI reads noise. Longer timeframe RSI reads trend. If they conflict, the longer timeframe wins.
- Assuming RSI 30 means a guaranteed bounce: RSI can reach 30 and keep falling. I’ve watched RSI go from 30 to 15 to 8 during genuine capitulation events. The indicator can stay at extremes far longer than your account can absorb the losses if you’re fighting a trend. “Oversold” and “about to reverse” are not synonyms.
- Applying standard settings to all assets equally: RSI on a liquid, high-volume asset like Bitcoin behaves differently than RSI on a small-cap altcoin with $2M daily volume. On illiquid assets, single large trades can push RSI to extremes in minutes. Those readings are noise, not signal.
The Bottom Line on RSI for Crypto Trading
The RSI is one of the most genuinely useful indicators in technical analysis, and it’s not going anywhere — but the way most guides teach it doesn’t match how it performs in practice.
The classic 70/30 overbought/oversold framework has real limitations in trending crypto markets, where assets spend extended periods above 70 without reversing. The research points toward using RSI as a trend-confirmation tool (above 50 = bullish, below 50 = bearish) rather than a reversal detector as the more effective approach, at least across major crypto assets.
Divergence is worth learning, but worth approaching with realistic expectations: it appears infrequently, it fails a meaningful percentage of the time, and it works better for position management than standalone entries.
If you’re serious about technical analysis, start with how RSI interacts with your primary timeframe, test the 50-midline approach, and build in confluence from price action and volume before acting on any reading. RSI is a tool. Your job is to use it accurately, not blindly.
Frequently Asked Questions
1. What is a good RSI level to buy crypto?
There’s no single answer, but RSI below 30 (or below 20 in volatile markets) suggests the asset has been heavily sold and a bounce may be due. The more useful framework is watching for RSI to recover back above 30 with price confirmation — a touch at 30 with no follow-through is common and often doesn’t lead to a sustained reversal. Always combine with support levels and volume before entering.
2. Is RSI actually reliable in crypto trading?
It depends on how you use it. As a reversal tool — predicting price turns at overbought or oversold extremes — it has significant limitations in crypto’s trending markets. A 2023 peer-reviewed study (PMC) found that basic overbought/oversold applications underperformed simple buy-and-hold. As a trend-following and momentum confirmation tool, the same study showed substantially better results. RSI is reliable as a momentum gauge; it’s unreliable as a standalone reversal predictor.
3. What’s the best timeframe to use RSI for crypto?
The 4-hour and daily charts with the default 14-period RSI are the most commonly reliable combination for swing traders focusing on Bitcoin, Ethereum, and major altcoins. Scalpers drop to RSI 7–9 on shorter timeframes (1M–15M). Long-term investors typically favor weekly RSI with a 21-period setting. There’s no universally “best” timeframe — it depends on your trading style and holding period.
4. What is the difference between bullish and bearish RSI divergence?
Bullish divergence: price makes a new lower low, but RSI’s corresponding low is higher than the previous one. This signals weakening downward momentum — potentially a reversal setup. Bearish divergence: price makes a new higher high, but RSI’s corresponding high is lower. This signals weakening upward momentum, potentially flagging an incoming pullback or reversal. Both work best as warning signals rather than standalone entry triggers, and both require confirmation from price action or volume to carry meaningful weight.
Risk Disclaimer: Cryptocurrency trading carries significant risk. Don’t put in money you need next month — crypto markets move fast in both directions, and RSI signals, like all technical indicators, fail regularly. None of this is financial advice. Talk to a qualified financial professional before making significant investment decisions.
Our Review Methodology
We evaluate each post based on thorough research, credibility of sources, accuracy of information, and relevance to our readers. Our editorial team follows strict guidelines to ensure all content meets high standards of quality.
Disclaimer
The content in this article is provided for informational purposes only and does not constitute financial, investment, or professional advice. Always do your own research before making any decisions.